Did you train more often, spend more time at high intensity, or improve your sustained power? Progress puts two periods of your training side by side, so you can follow each difference from the weekly totals to the efforts behind it.
The screenshots use synthetic training data, viewed as of 10 September 2026.
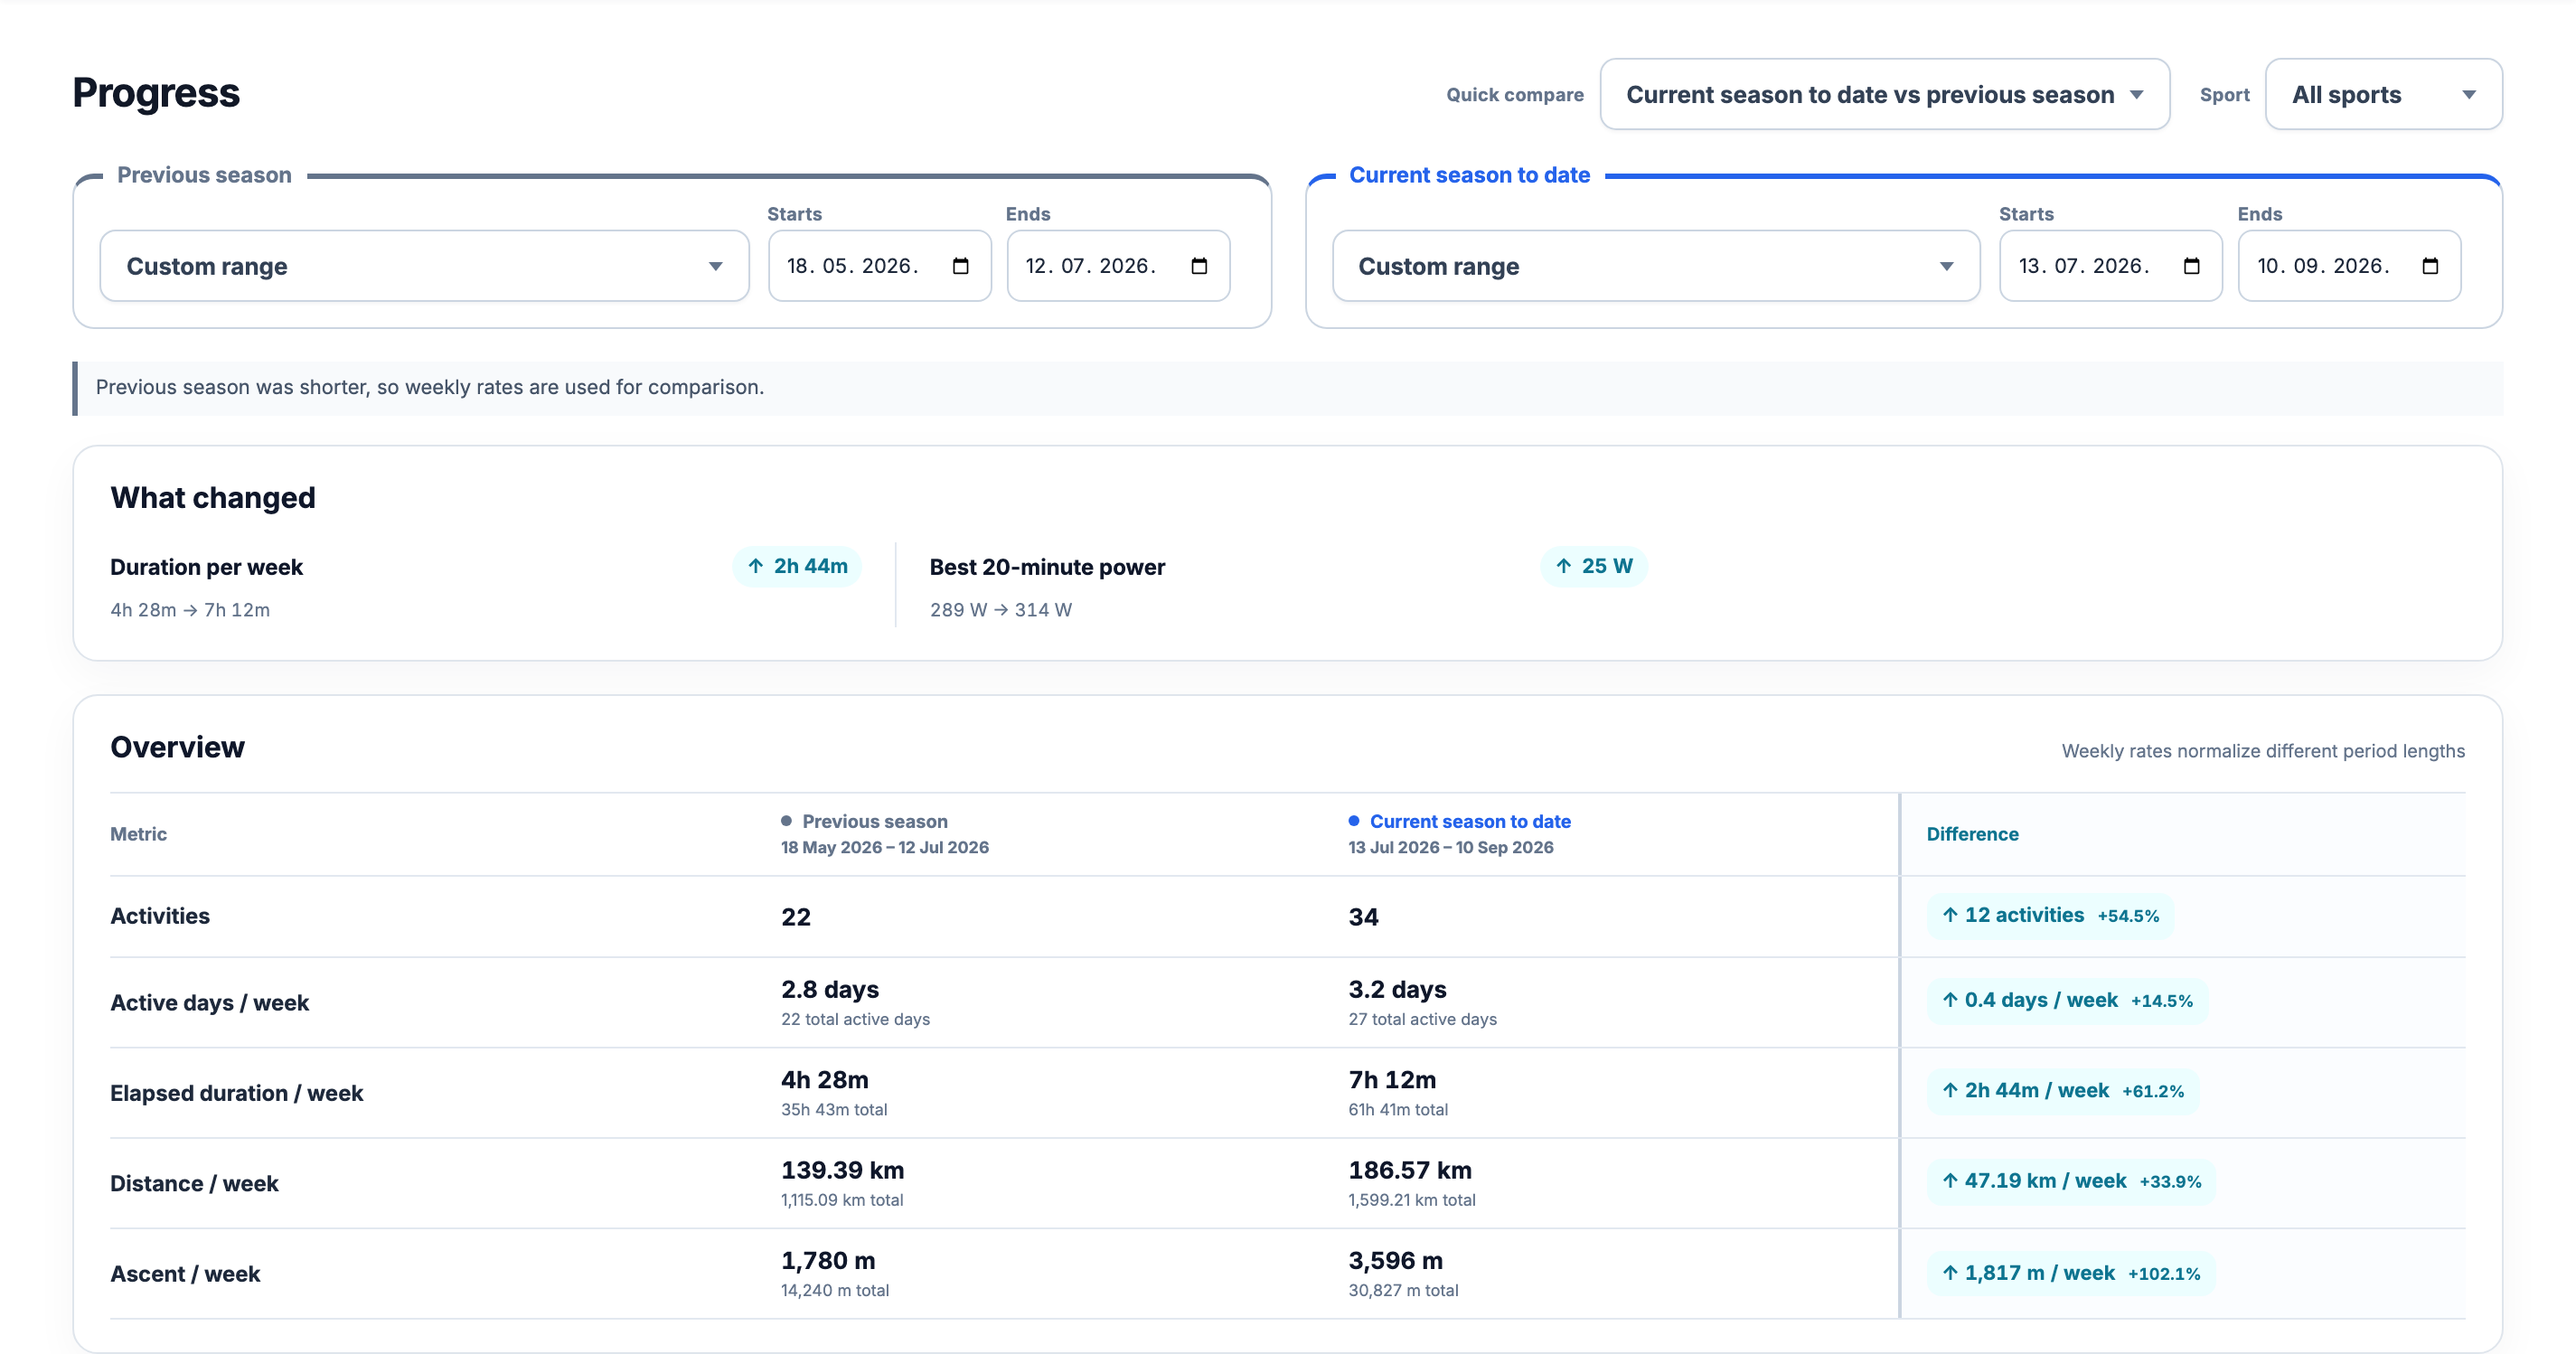
Choose two training periods
Open Progress in the web app. Start with Quick compare: the last 7 days, 4 weeks, 42 days, 12 weeks or 365 days, each against the preceding period. You can also compare the last full week with the week before, or this year to date with the same part of last year. Year to date and the last 365 days are separate choices: one starts on 1 January, the other looks back a full rolling year.
For a training block, use the season comparisons or choose Custom range and enter each period’s start and end dates. Both dates are included. The older period is the baseline on the left; the newer period is on the right. The selected dates remain above the report and in its Overview.
Keep All sports for a view of your whole training routine, or choose Cycling, Running, Swimming, Walking, Hiking, Strength or Other. A sport filter helps answer a narrower question without mixing a change in your sport choices with a change in your training.
Give a date range a name
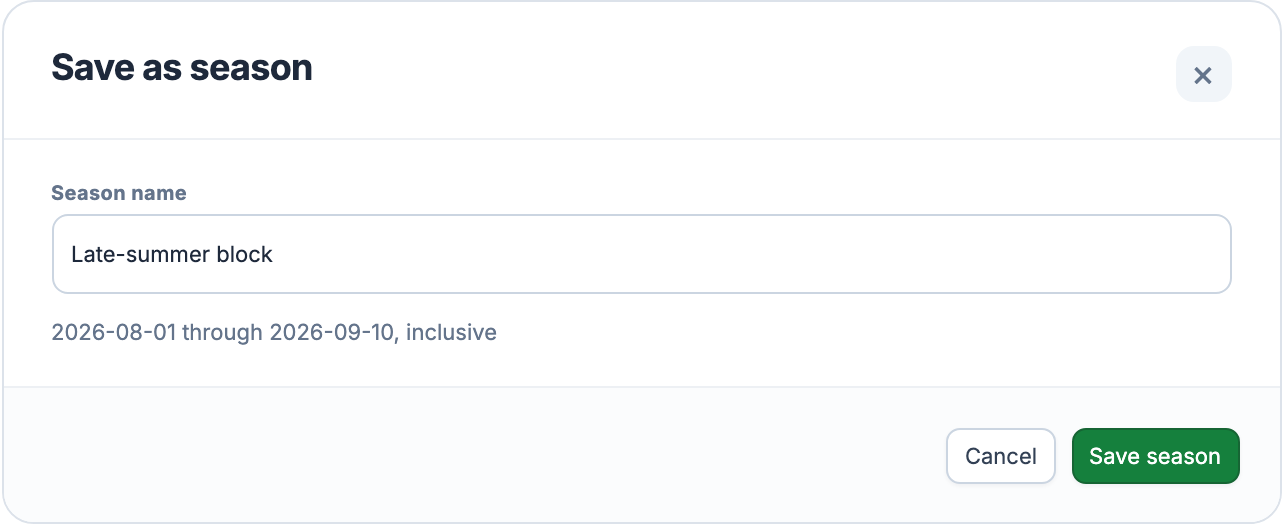
A saved season can be a whole race season or a shorter block such as Base, Build or Late summer. Create and edit these ranges in Account and Training Preferences, then select a saved name for either side of Progress. A season stores dates; it does not generate a training plan.
You can also save a range without leaving the report. After you manually edit the custom dates, Save as season appears when that exact range is not already saved. Give it a name, check the inclusive dates and choose Save season. Cancel leaves the season list unchanged. If you have no seasons yet, the period selector’s Configure seasons option opens the season settings directly.
The current season to date comparison uses only the elapsed part of the season and the corresponding span of the previous season. If that previous season ends sooner, Progress tells you it was shorter and uses weekly rates. The last completed season comparison is useful when both blocks are finished. Season presets are available when the required saved ranges exist.
See what changed
What changed highlights up to three differences supported by the available data. In this example, weekly duration rose from 4h 28m to 7h 12m. That is 2h 44m more per week. The arrow describes the direction of the change; it does not decide whether more training was better for you.
The Overview adds activity count, active days per week, elapsed duration, distance and ascent. Activity count is a raw total. The other rows put weekly rates first and retain the period totals underneath. This matters when one period contains more days: 34 activities versus 22 alone does not tell you how much a typical week changed.
A quiet summary can mean there was no material difference in metrics with sufficient coverage. Too little comparable data is shown as a separate message. Neither means that missing training or sensor values were counted as zero.
See how the weeks built up
Volume and load plots the two periods from their respective starts: Week 1 against Week 1, then Week 2 against Week 2. Switch between Duration, Distance, heart-rate load (TRIMP) and power-based load (PSS). The summary above the chart keeps the weekly comparison visible while the lines show how it developed.
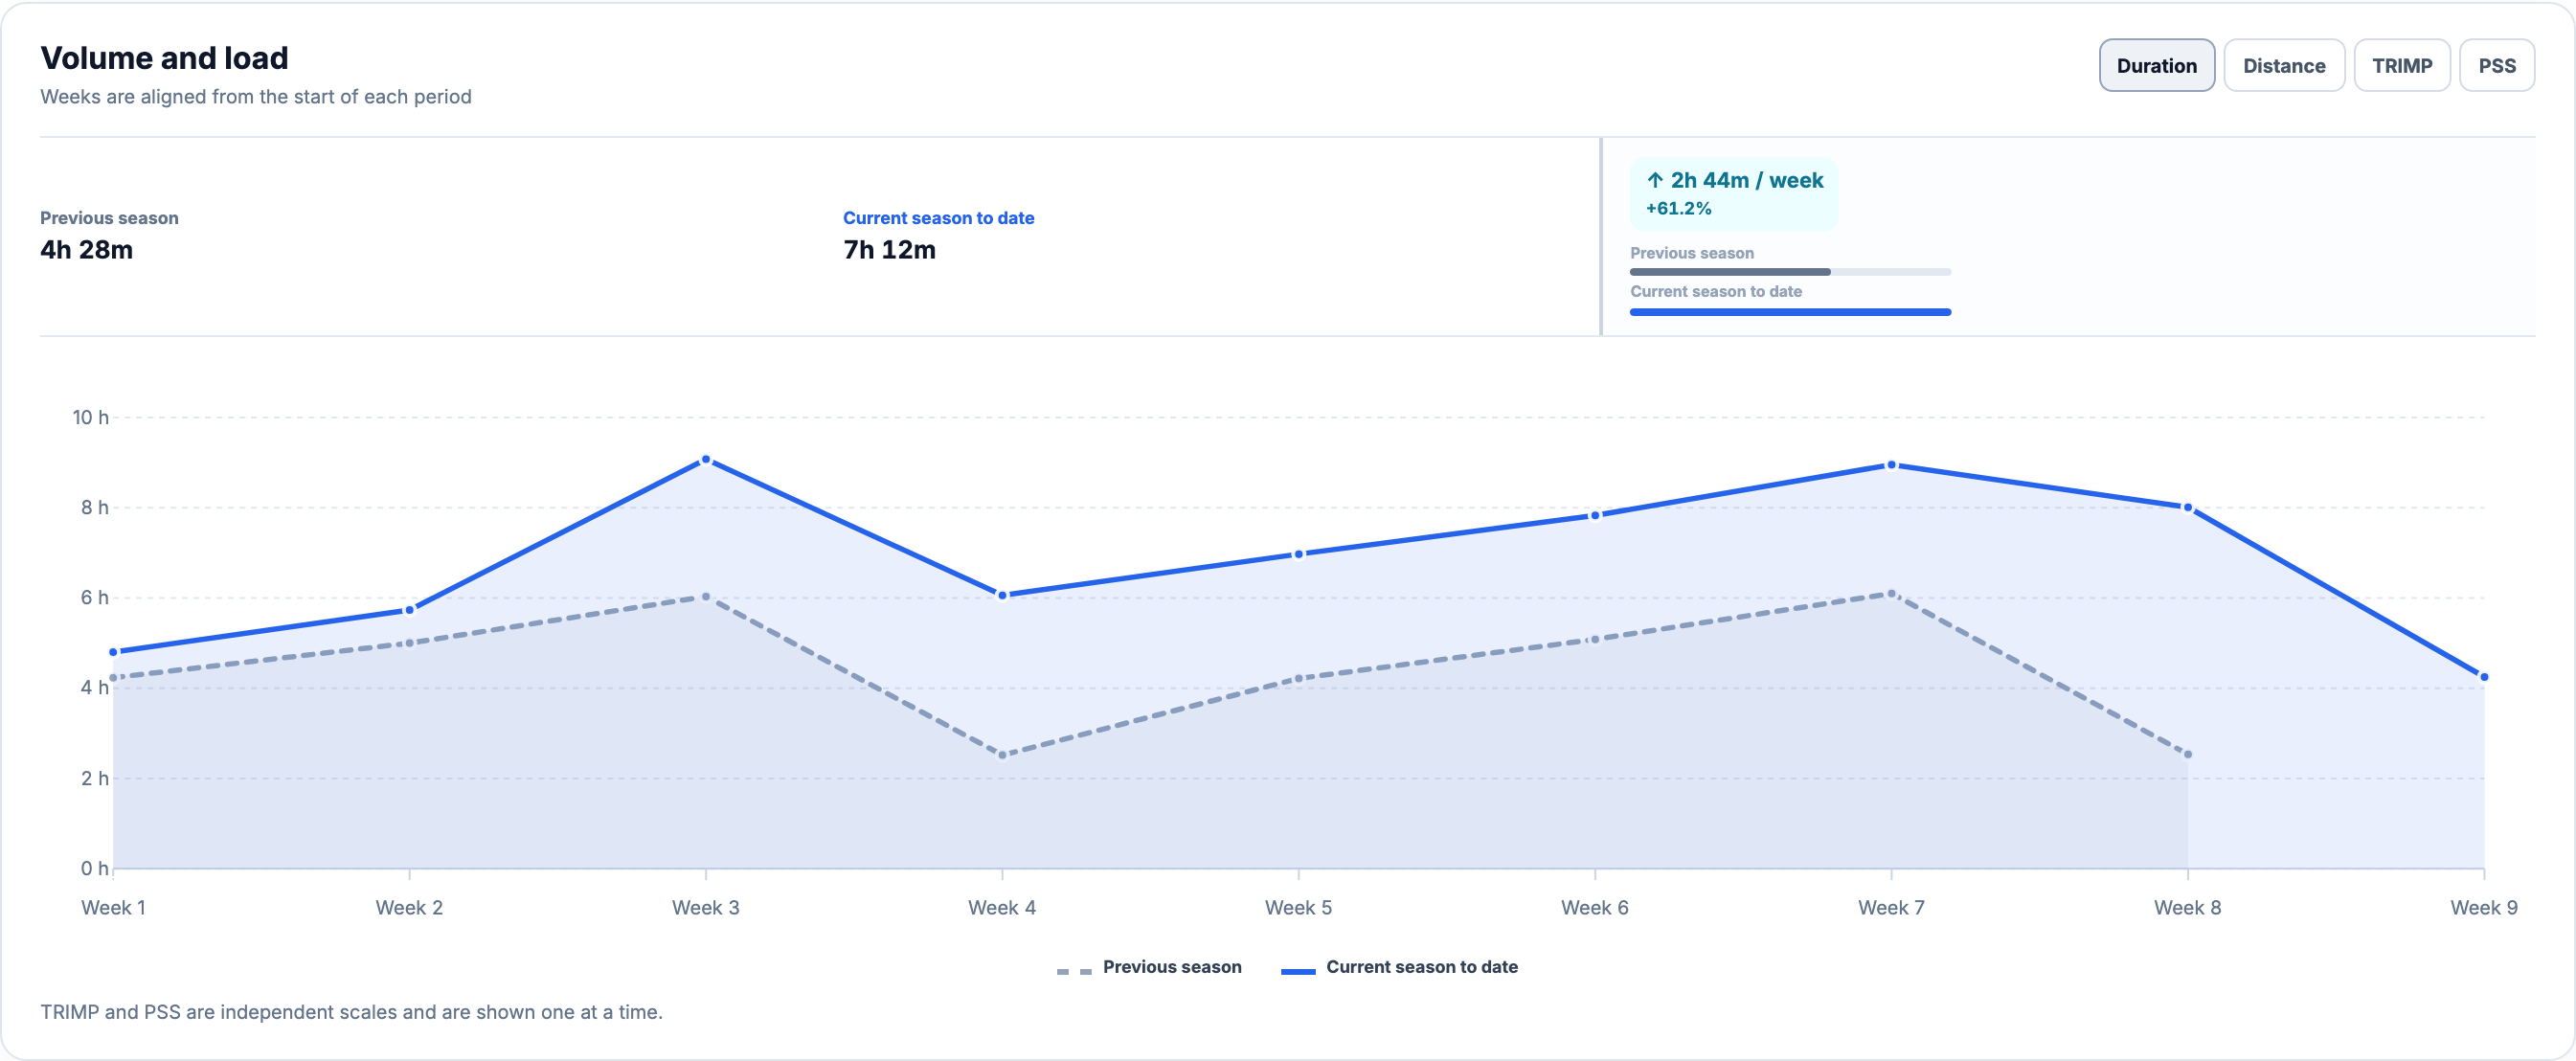
Duration can still be available when a recording has no usable heart rate or power. TRIMP and PSS need their own source data and are different scales, so the chart shows one at a time. Training Load explains those measures; Training Volume follows volume over a longer history. The Dashboard’s usual-volume range answers a different question: how a week compares with your recent routine, rather than with a second range you chose.
Check where the extra time went
More hours do not tell you whether the added work was easy or hard. Intensity distribution compares the share of recorded time in each zone. Switch between Heart rate and Power; each zone shows both its duration and its percentage. The current period uses a solid outline and the baseline a dashed one.
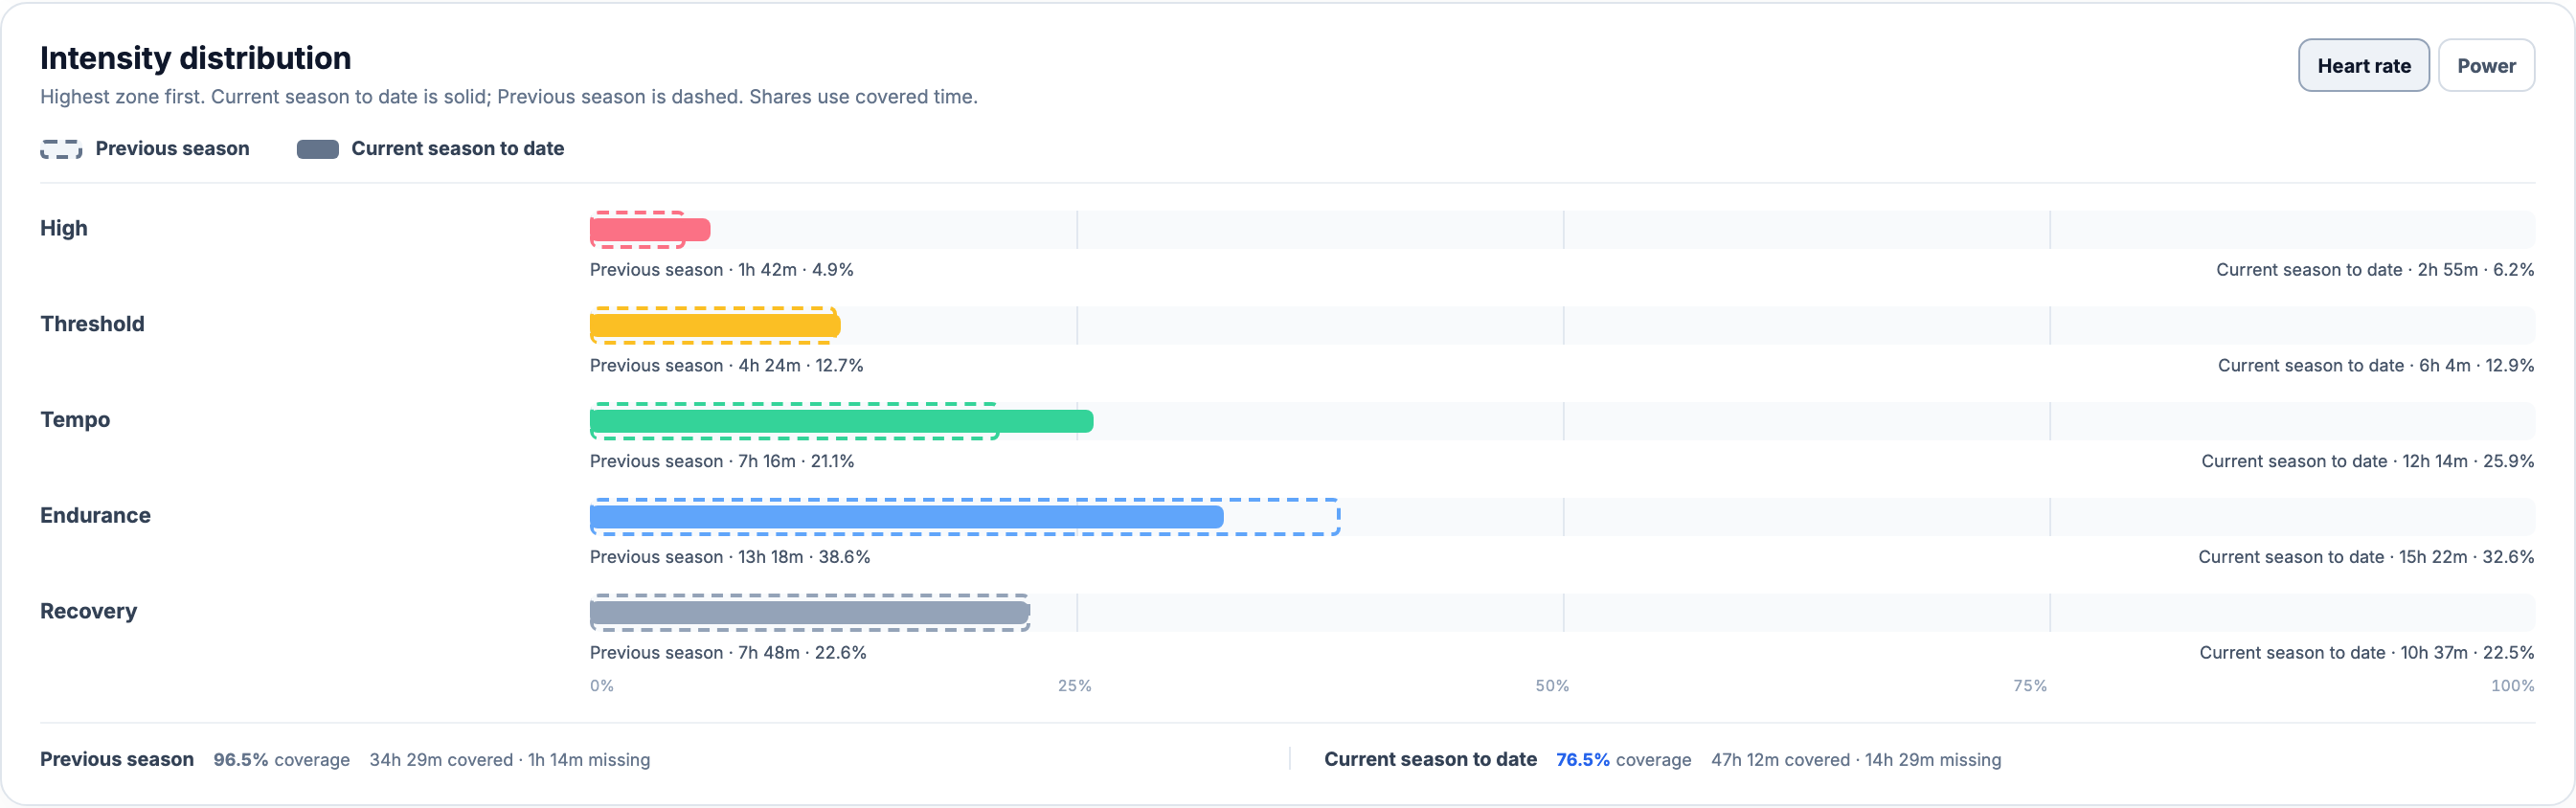
Read the coverage before interpreting a shift. A period with more missing sensor data may show a different distribution simply because fewer sessions contribute. Changes to your zone thresholds or mix of sports also affect the result. Training Zones explains those inputs.
Keep health measurements in context
When daily-health history is available, Health measurements compares the latest body fat and VO₂ max measurements in each period, plus period averages for SpO₂ and sleep score. Latest measurements retain their dates; averages show how many observations contributed. These readings describe the selected dates and are not filtered to a sport.
A missing reading is Not available, not zero. In the demonstration account, neither period has these health measurements, so the panel says so while the training comparison remains usable. Check-ins and Notes explains manual measurements, and Recovery and Readiness provides the separate view of recent recovery.
Find which efforts improved
The Performance section compares best recorded efforts at the same durations. Cycling and running can show Power and Heart rate; running also offers Pace. With All sports selected, the report keeps performance results in separate sport sections. The curves and values available depend on the recordings in each period.
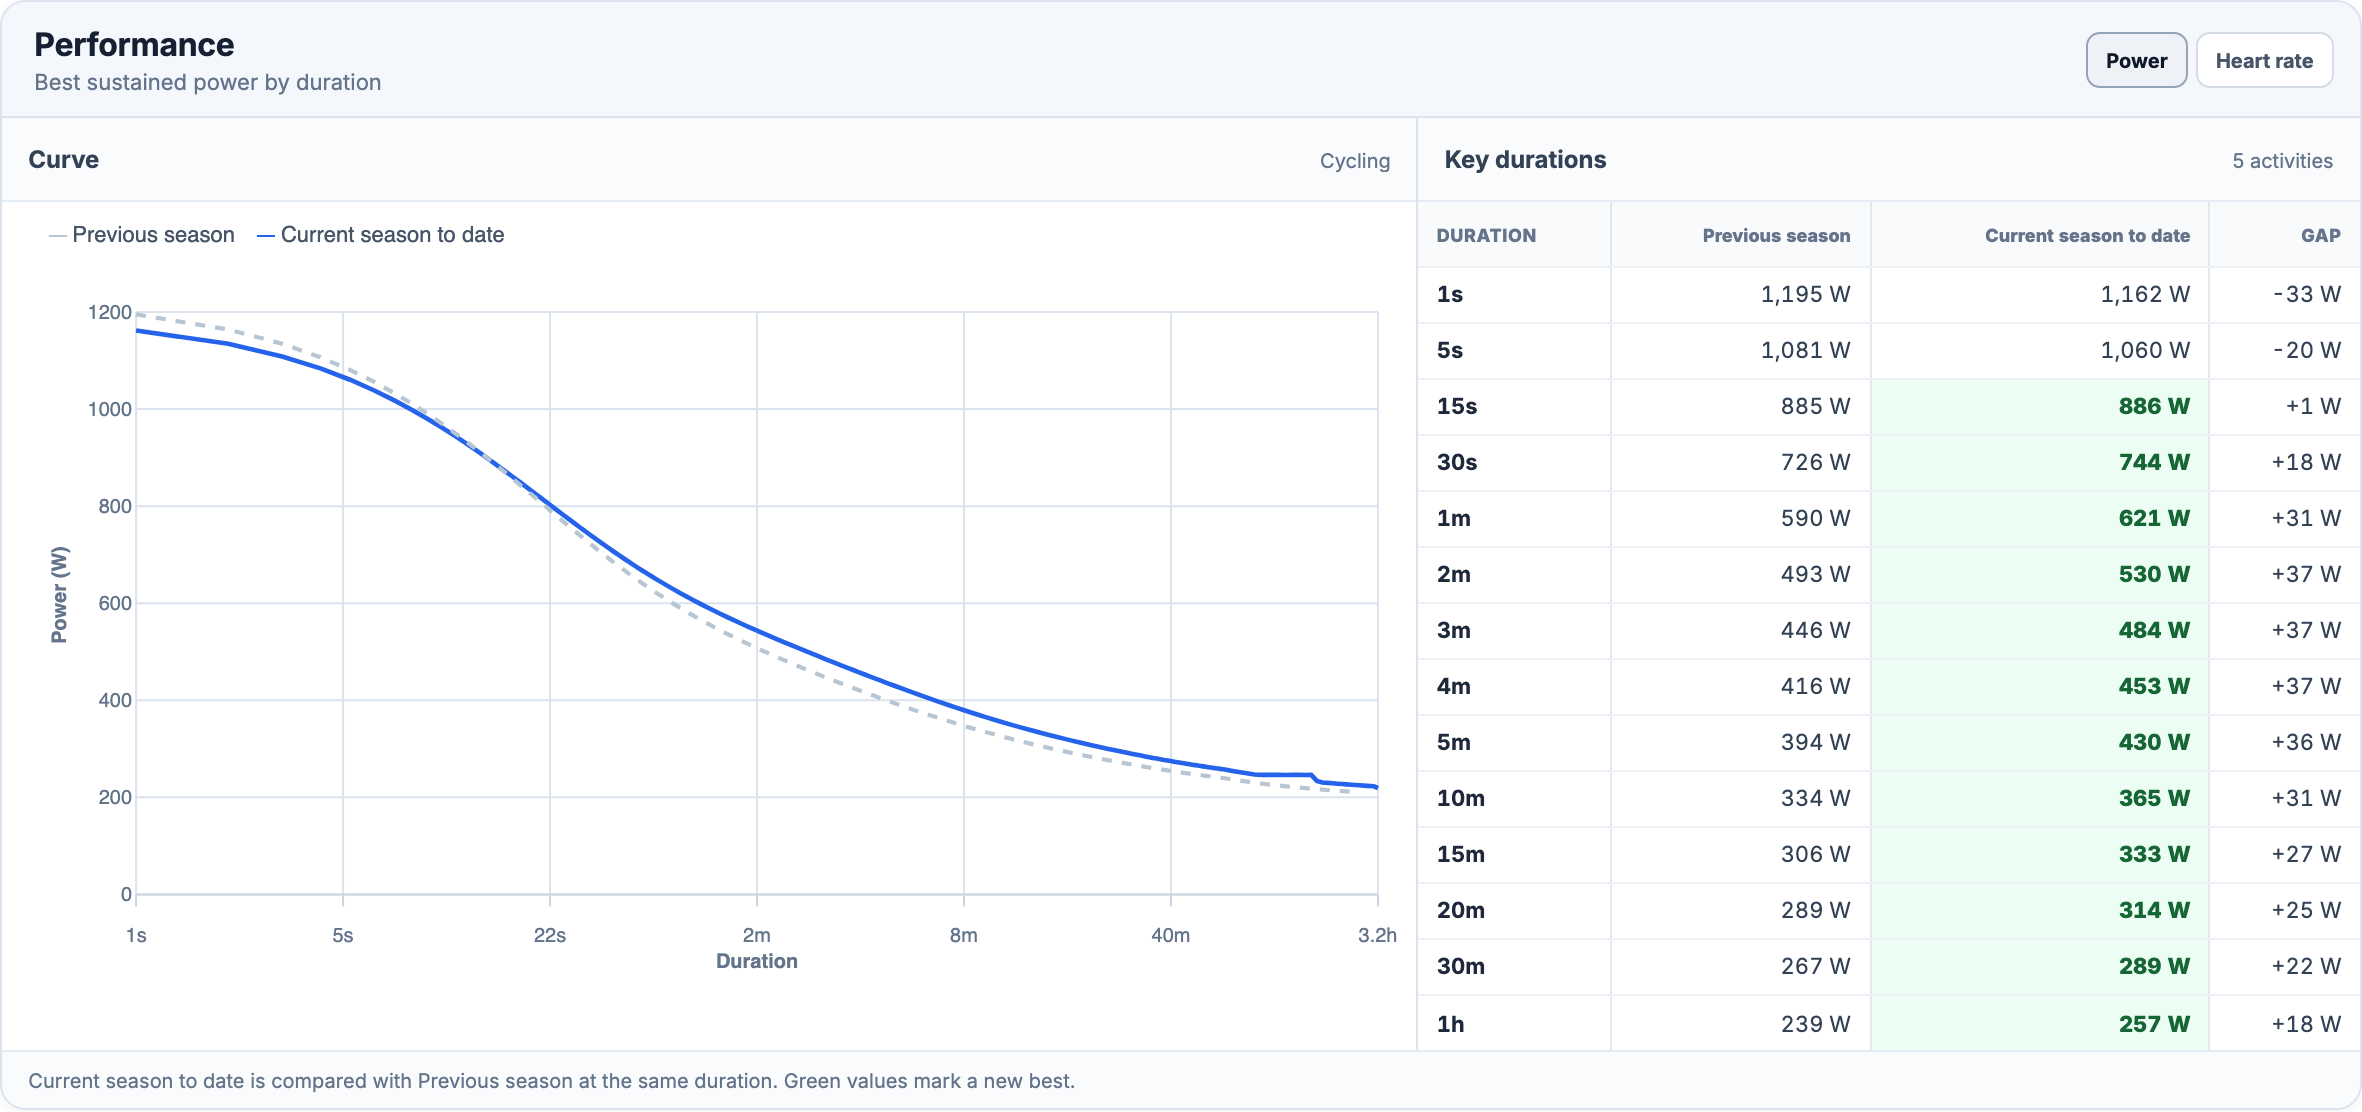
A stronger five-minute effort does not imply that every other duration improved. Read the Gap beside the value. Running pace results include a dated Source link to the source activity; the period’s activity list lets you inspect the wider set of recordings. Missing values remain unfilled. A best recorded effort shows what you did during that period; it does not establish the maximum you could achieve. A higher heart-rate value is not automatically a better result.
To inspect several whole sessions side by side, continue to Activity Comparison. For repeated efforts on one climb or stretch of road, use Private Segments.
Open the activities behind the comparison
At the bottom of the report, each period has a View activities link that opens the Activity Library with that date range and sport filter. Download CSV exports the comparison for further inspection. The report URL preserves its selected dates, so reopening it does not silently advance a custom comparison to a different day.
Progress period and season comparison is included in Free as well as Pro. You need recorded activities in the selected ranges; individual load, intensity, health and performance measures need compatible data and enough coverage. If both periods are empty, No activities in these periods directs you to choose other dates or inspect the filtered activity lists. Use Import and Export or Device Sync to bring recordings into your history, and Training Calendar when you want to plan the next block.
All Pro features are free through January 31, 2027. No credit card or automatic charges. After Early Access, keep using Free or choose Pro. See Free and Pro plans.