Explore heart rate variability (HRV) in a recorded workout. EffortSignal shows recorded R-R intervals on a timeline, pairs consecutive intervals in a Poincaré plot and calculates four HRV metrics for the activity. Use the charts to inspect changes in the recording and the values behind its summary.
Start with a recording that contains R-R intervals
An R-R interval is the time between two consecutive heartbeats, measured in milliseconds. A heart-rate trace in bpm and a sequence of individual beat intervals contain different detail. Ordinary bpm samples cannot reconstruct missing R-R intervals, even when heart rate was recorded every second.
EffortSignal reads R-R data from compatible FIT activity recordings with HRV messages. The sensor, recording device and exported file must preserve those intervals. A heart-rate monitor being connected does not, by itself, confirm that the activity file includes them.
Import the recording into your account or open an existing activity from your history. The general file importer also accepts TCX and GPX, but those extensions alone do not establish workout HRV support. Check the original FIT recording for its beat data if an export only shows heart rate.
Find HRV in the Heart rate tab
In the web app, open the activity and select Heart rate above the charts. Available R-R data adds the R-R intervals timeline and, when consecutive pairs exist, the Beat-to-beat variability plot. Settings below the charts lets you choose visible rows and their order.
Use Pan to move through the timeline or Zoom to inspect a shorter section. The HRV summary and scatter plot describe the whole activity; selecting a time range does not recalculate them for that range.
See when the beat intervals change
The R-R timeline places the intervals against elapsed time. Shorter intervals correspond to a faster heart rate: 500 ms per beat corresponds to 120 bpm, while 1,000 ms corresponds to 60 bpm. The changing spacing between intervals is what the HRV analysis examines.

Move across the chart to inspect its values. Look at a transition, pause or isolated spike in the context of the activity’s heart rate and available power or pace. The timeline tells you when a change appears; a single summary value cannot show where it happened.
Read the four workout HRV metrics
EffortSignal calculates the summary from the available R-R intervals for the whole activity. On desktop it sits beside the scatter plot; on a narrow screen it appears above it.
Avg. R-R interval
Arithmetic mean of the available beat intervals, in milliseconds.
RMSSD
Square root of the mean squared difference between successive intervals, in milliseconds.
lnRMSSD
Natural logarithm of RMSSD calculated in milliseconds; this value has no millisecond unit.
SDSD
Sample standard deviation of successive interval differences, in milliseconds.
RMSSD and SDSD can be close without being the same calculation. An average needs one interval, RMSSD needs at least two and SDSD needs at least three. If RMSSD is zero, lnRMSSD is unavailable. A dash marks an unavailable result; it does not mean zero variability.
Explore the Poincaré plot
Beat-to-beat variability pairs each interval with the next. R-R(n) is on the horizontal axis and R-R(n+1) on the vertical axis, both in milliseconds. Hover a point to read its two values.
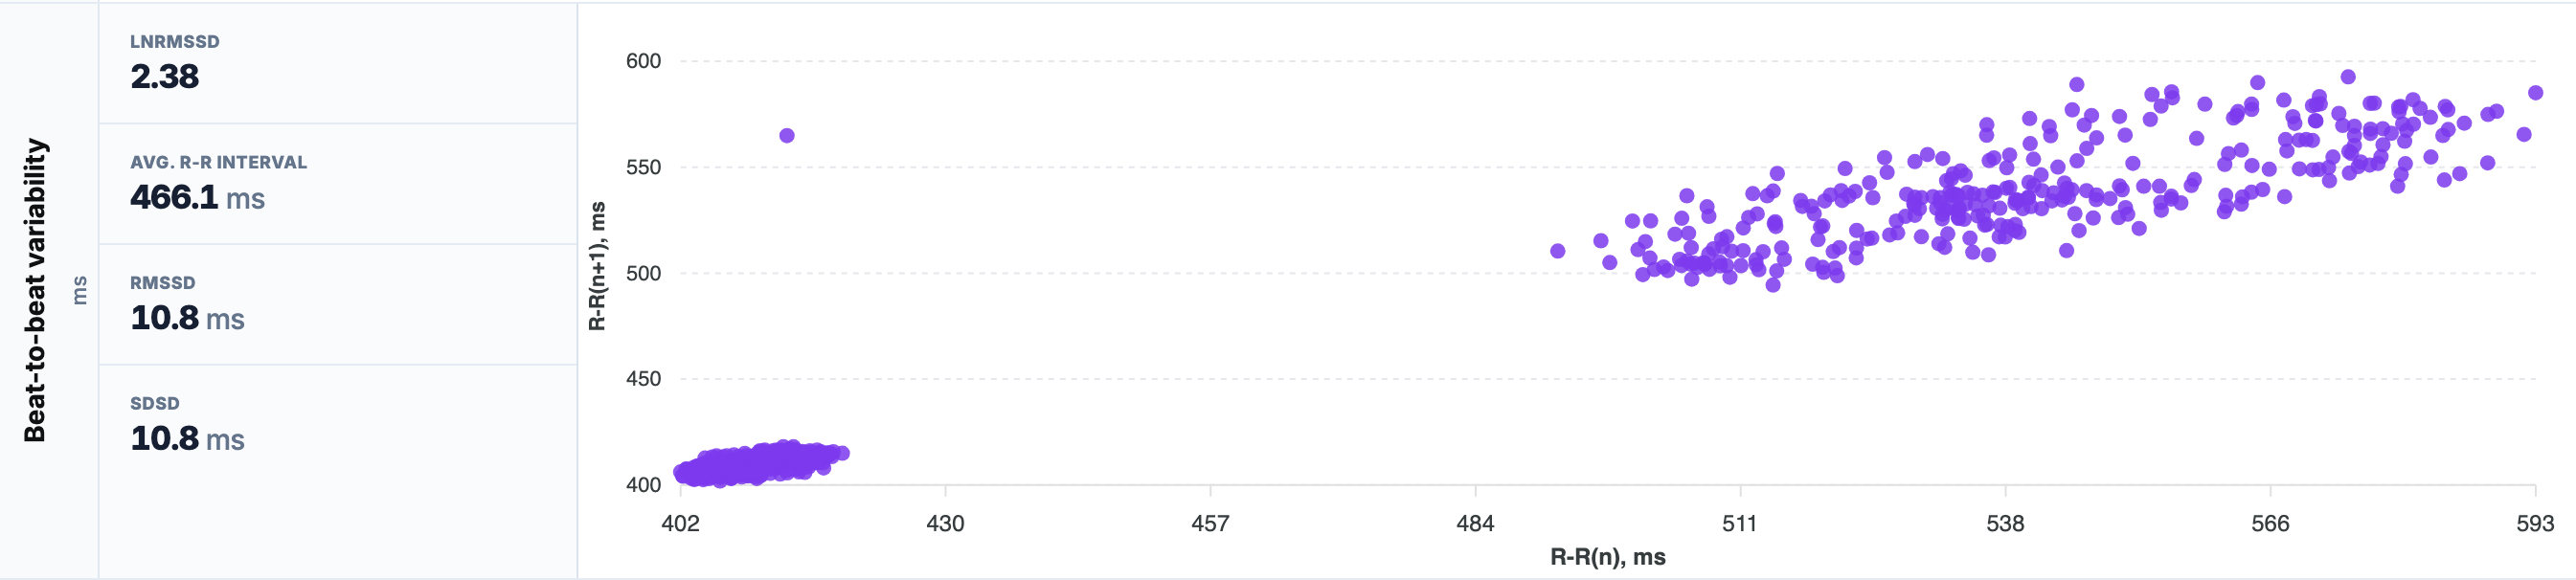
Similar consecutive intervals lie near the diagonal; larger differences place points farther away. The plot has no time axis, so use the timeline to locate a change within the workout. Pan and Zoom on the time charts do not narrow this scatter plot.
Check the recording before interpreting a number
EffortSignal excludes non-finite and non-positive R-R values. Positive outliers can remain: this is not a full ECG artefact-correction process. Review an unusual point in the source recording before treating the summary as a reliable description of the session.
The timeline and scatter each display at most 800 points. Summary metrics use the underlying available intervals before that display reduction, so the visible dots are not a complete list of the values used. Recorded intervals during pauses can also contribute.
If heart rate is visible but the R-R views are missing, check both the source file and chart Settings. A short R-R recording may support only some summary metrics. Re-exporting ordinary bpm samples cannot add beat intervals that were never recorded.
Keep workout HRV separate from daily Readiness
The workout summary combines the recorded phases of that session. When comparing activities, account for their duration, work and recovery sections, pauses and recording conditions. A whole-ride number does not isolate any one of those phases.
Workout HRV is not substituted for nightly HRV in Readiness. Daily Readiness uses its own measurements and personal baselines. This activity view provides the R-R timeline, Poincaré plot and four summary metrics; it does not report DFA α1, SD1/SD2 or an HRV-derived training threshold.
Available on Free and Pro
Workout HRV analysis is part of the web app’s activity analysis on Free and Pro. You need an account and an activity with usable R-R data. No power meter or GPS route is required for these beat-interval views.
Related guides
All Pro features are free through January 31, 2027. No credit card or automatic charges. After Early Access, keep using Free or choose Pro. See Free and Pro plans.