A new power best and a quieter training week can happen together. Signals picks out changes in your recorded history and puts the comparison beside them: what changed, by how much and over which dates. Start there, then open the relevant training view to understand the detail.
The screenshots use synthetic training history in the web app. Signals is included in Free and Pro.
Read the observation, the comparison and the date
Open Dashboard → Signals. The panel shows up to three observations, with new power bests first. Each row names a change, gives the supporting values and shows the activity date or comparison window. It is a short selection of qualifying changes, not a list of every workout.
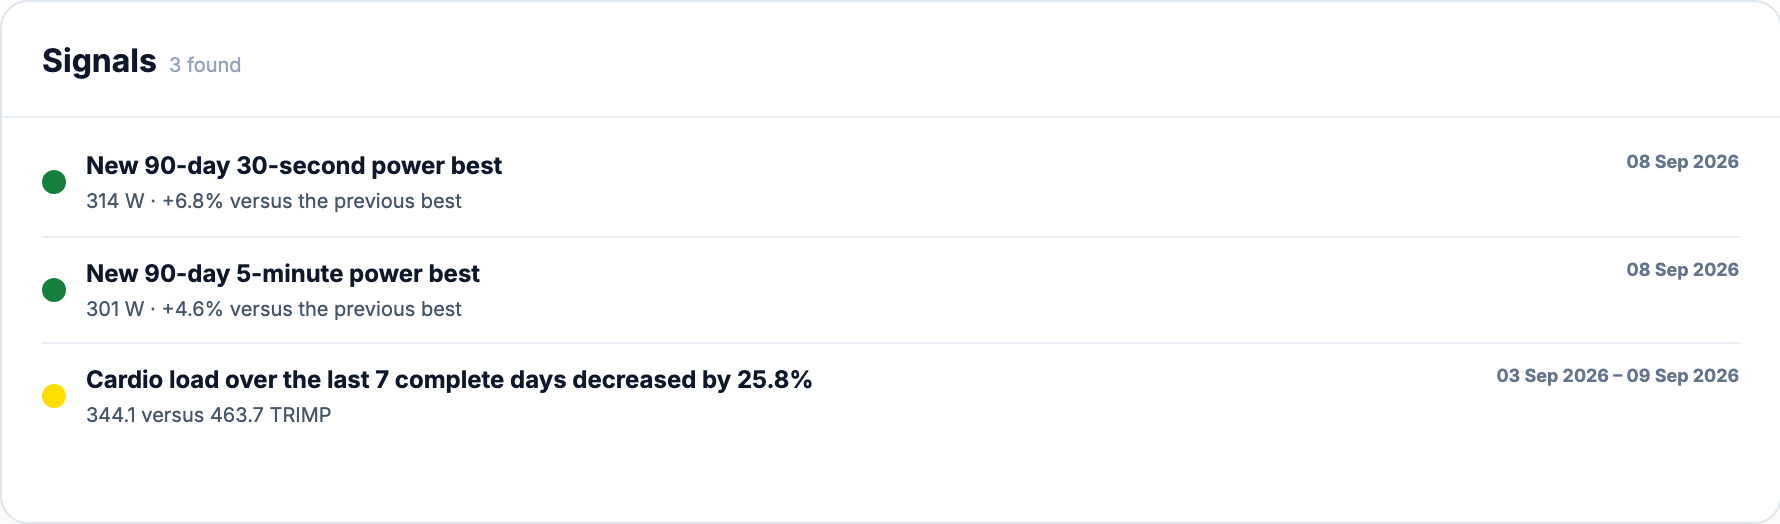
The Dashboard date sets the observation date in your account timezone. Period trends use complete days ending the day before it; a completed workout from the selected day can already supply an individual-workout observation. The 42D, 3M, 6M, 1Y and 2Y controls change the training charts, not the named windows inside Signals.
Green marks a new power best. Red marks unusually high load in a recent workout or acute load above the longer-term level. Yellow marks the other changes. These colours identify the observation; more volume is not automatically better, and a quieter week is not automatically a problem.
A power best belongs to one duration
Signals checks 30-second, 5-minute and 20-minute power in the most recent eligible workout from the last seven days, including the selected day. It compares each duration with earlier efforts in the same sport over 90 days. A result needs at least three previous activities with that duration, an improvement of at least 3% and at least 5 W. Several durations can produce separate rows.
For example, 309 W against a previous best of 300 W is a 9 W, or 3%, improvement. With enough comparable history, that meets both size thresholds. This is an illustrative calculation, not a screenshot value. A power best describes recorded performance; it does not by itself establish a new FTP.
Separate a hard workout from a heavier week
Cardio-load change compares total TRIMP over the last seven complete days with the preceding seven. It needs complete daily calculations and at least 90% duration-weighted TRIMP coverage in both periods. This measures a change in recorded heart-rate load, not a change in how your cardiovascular system responds to the same effort.
Acute versus chronic load compares ATL/CTL with its value seven days earlier. A signal needs a qualifying move above or below the rule’s boundaries, enough reliable load history and sufficient heart-rate coverage. The two ratios in the row explain the change; they are not a Readiness score.
An unusually high workout load uses the latest completed activity with load data from the last seven days. It compares PSS, or TRIMP when PSS lacks enough evidence, with the median of five to eight earlier activities in the same sport from the preceding 90 days. The load must be at least 1.5 times that median and at least 30 points higher. The comparison does not claim those workouts had the same route or duration.
Time, frequency and intensity tell different stories
Volume trend adds elapsed training time across four consecutive seven-day blocks. Each step must rise or fall by at least 10% in the same direction, with at least 90 minutes between the first and last totals. Every block needs recorded duration. These rolling blocks are not necessarily the calendar weeks shown in Training Volume.
Frequency counts activities, not hours or active days: two sessions on one day count as two. The last seven complete days are compared with the median count of the four preceding seven-day blocks. This check needs at least 35 complete days of history, so a new account’s missing earlier weeks are not treated as weeks without training.
Intensity compares the share of time at threshold or high intensity over 14 complete days with the preceding 28. A shift needs at least 10 percentage points, at least 30 minutes in the affected domain in the current period, and enough qualifying recordings in both periods. It uses stored heart-rate zones; changed zone boundaries can make the comparison unavailable.
Take the date to the view that holds the evidence
The current Signals rows are summaries, not links to workouts. For a power best or unusual workout load, open Activities and find the recording by date. Activity Analysis shows its measurements; Performance Curves lets you inspect the effort duration and comparison. Check the recording and sensor coverage before drawing a conclusion.
For period changes, use Training Load for daily TRIMP and ATL/CTL, Training Volume for time and load totals, and Training Calendar for the distribution of sessions. Progress compares two chosen periods. Keep the signal’s dates when comparing views; matching the chart range alone does not make two windows equivalent.
A quiet panel can mean different things
No notable changes means the analysis completed without reported limitations and no change met the signal rules for that date. Collecting your baseline means more history is needed. Signal analysis is not available yet means the available evidence cannot support a complete check. Missing power does not become zero power; enough history for one check does not guarantee that every check can run.
A new account with no activities or connected provider shows Get started, with file import and integration setup. A failed request shows Signals unavailable and Try again. These states are different from a completed analysis with no changes. Signals describes recorded training; it does not diagnose recovery or prescribe the next workout. Readiness provides the separate view of available recovery factors.
All Pro features are free through January 31, 2027. No credit card or automatic charges. After Early Access, keep using Free or choose Pro. See Free and Pro plans.