See how ground contact and vertical movement change during a run. EffortSignal plots the running dynamics saved in your activity recording, so you can inspect a faster block, a recovery or the final minutes of a session alongside its pace and heart rate.
What data does running dynamics need?
Start with an activity file that contains running dynamics from a compatible watch or sensor. EffortSignal reads ground contact time, ground contact balance, vertical oscillation and vertical ratio from supported FIT fields. Each channel needs its own recorded samples.
You can import the original FIT file or open a run already in your account. The importer also accepts TCX and GPX, but the file extension alone does not guarantee these sensor fields. A GPS route or a heart-rate trace cannot supply missing ground contact measurements.
Open the Running dynamics tab
In the web app, open your activity and choose Running dynamics above the charts. The tab appears when the recording contains supported dynamics data. Settings below the charts lets you choose visible rows and change their order.
Pace or speed and cadence belong to the separate Terrain & Run Dynamics tab, called Run Dynamics for indoor activities. Heart rate and recorded running power have their own tabs. This keeps the contact and vertical measurements together while the rest of the run remains easy to inspect.
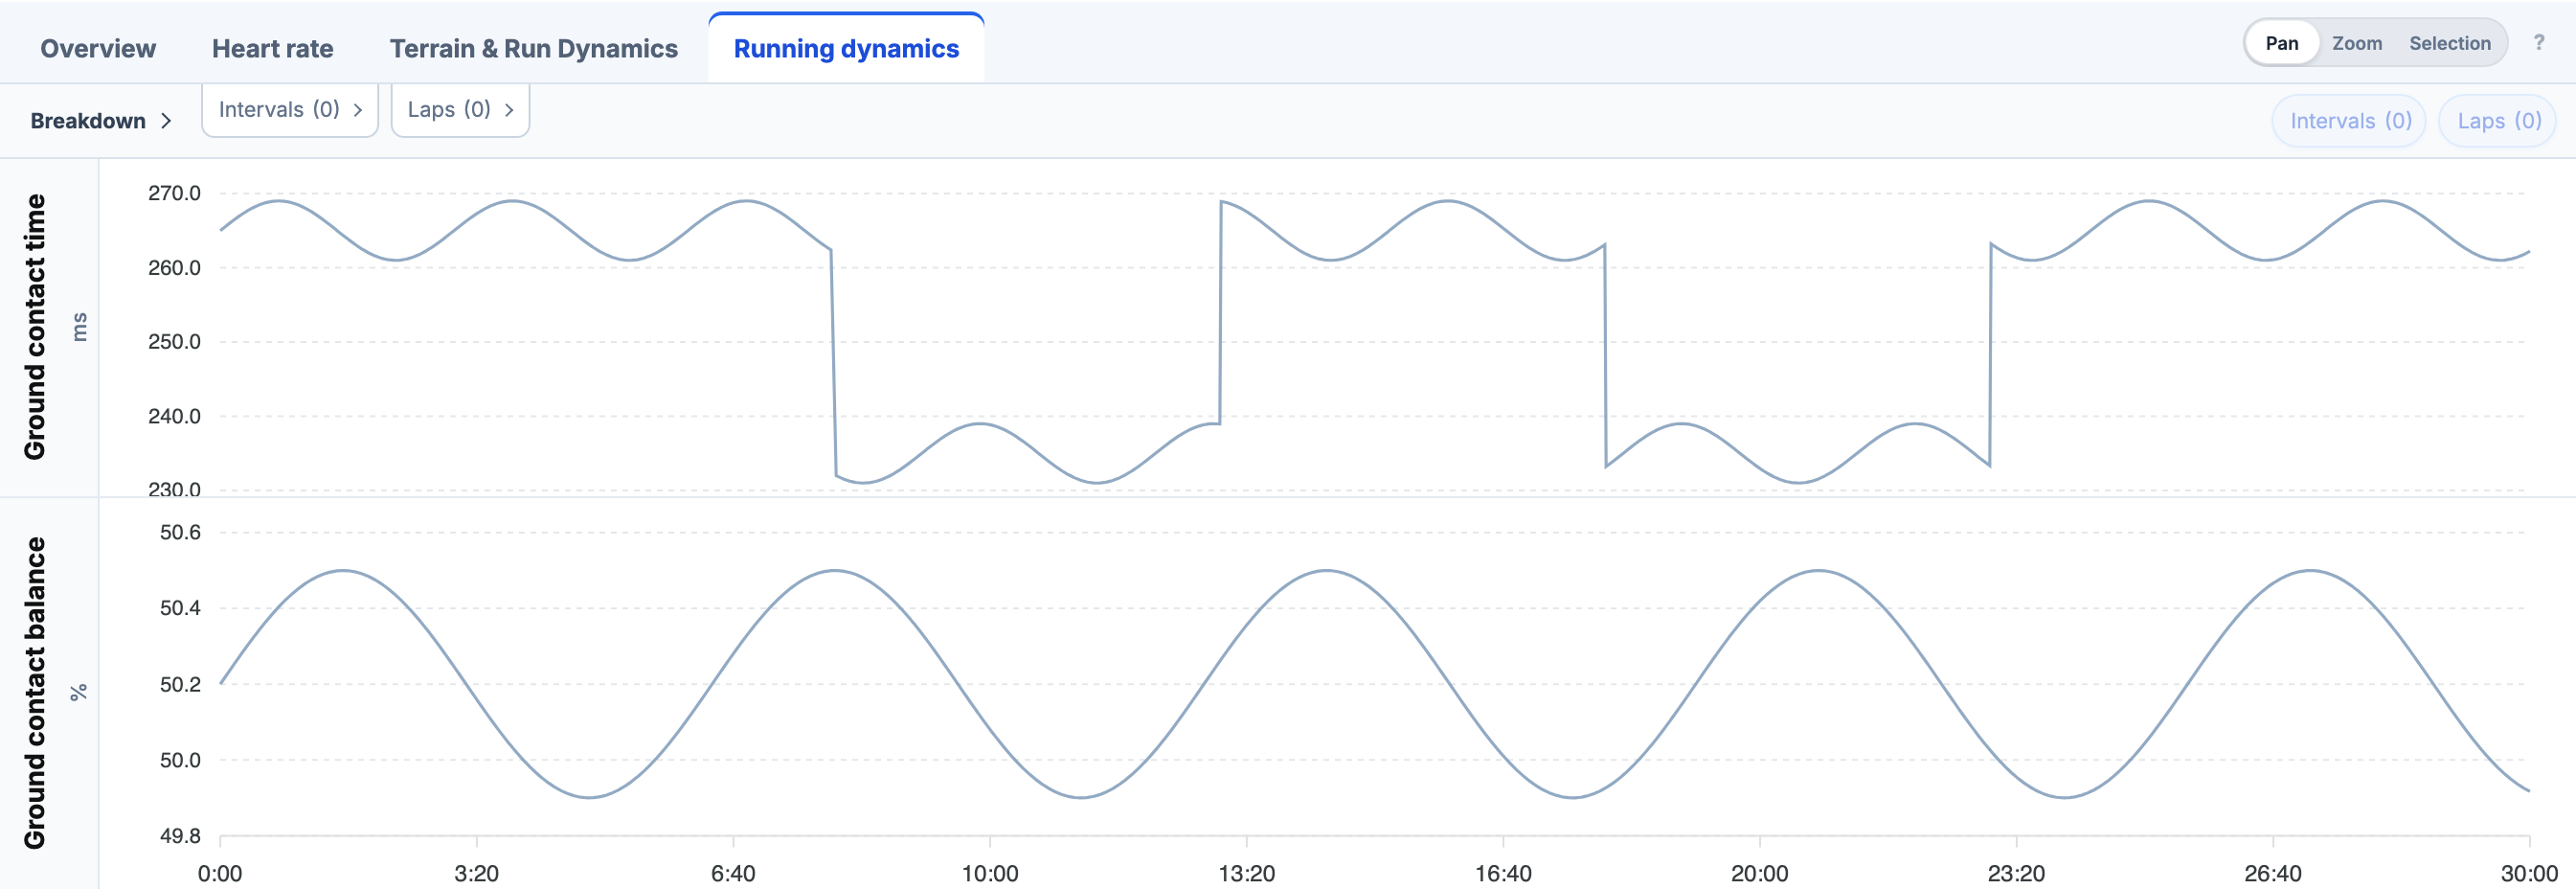
Ground contact time and balance
Ground contact time
Ground contact time measures how long your foot stays on the ground during a step. EffortSignal displays the recorded value in milliseconds (ms). Follow the line through a faster section or recovery to see where that duration changes.
Ground contact balance
Ground contact balance describes the distribution of contact time between the left and right foot. The chart shows the recorded percentage (%). Read the value with the source device convention in mind; the percentage trace is not a separate measurement of each leg.
Vertical oscillation and vertical ratio
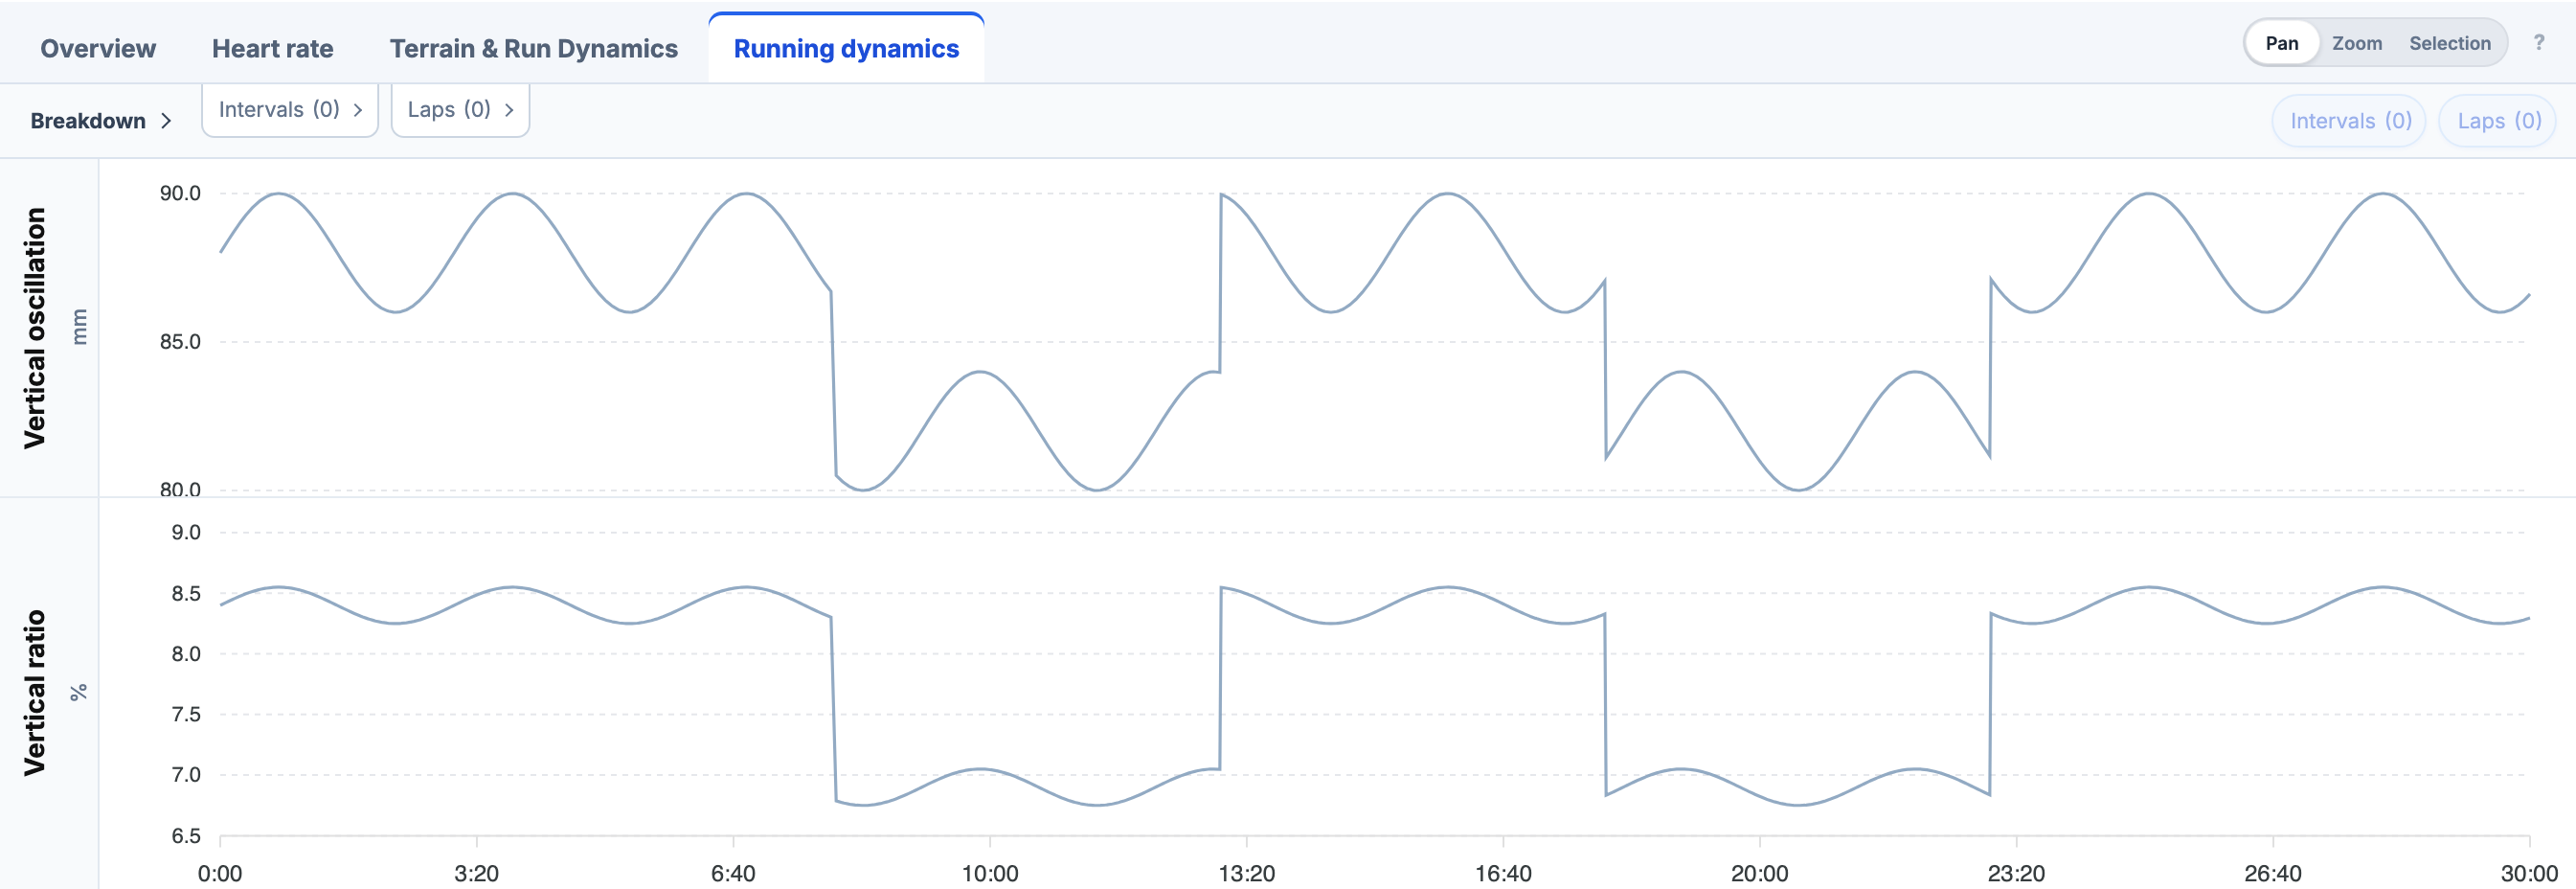
Vertical oscillation
Vertical oscillation describes the up-and-down movement of your torso with each step. EffortSignal displays this recorded channel in millimetres (mm). For example, 80 mm is 8 cm, so check the unit before comparing it with a watch screen that uses centimetres.
Vertical ratio
Vertical ratio expresses vertical oscillation relative to stride length as a percentage (%). EffortSignal plots the ratio stored in the recording. It does not reconstruct a missing ratio from the GPS track, and stride length is not one of the four standard Running dynamics charts.
Garmin running dynamics definitions (PDF)
Inspect a section of the run
Use Pan to move along the timeline and Zoom to look more closely at a section. Hover over a chart to inspect its recorded values. The elapsed-time axis helps you find the same effort when you switch to heart rate or movement data.
A change in contact time or vertical motion is a reason to inspect the surrounding run. Check whether pace changed, whether the section was uphill and whether the recording contains a pause. Compare similar sections before treating a lower value as an improvement. These charts show measurements; they do not assign a running-form score or prescribe a technique change.
Why is a chart missing?
First check Settings in the activity to see whether the row is hidden. If a channel was not recorded or did not survive the export, EffortSignal cannot display it. A run may contain vertical oscillation without contact balance, or pace and heart rate without any running dynamics.
Check which measurements your watch and paired sensor can record, then inspect the original activity export. Connecting a provider does not add measurements to an older file. Indoor runs can show dynamics when those samples are present; the contact and vertical charts do not require a GPS route.
Available on Free and Pro
Running dynamics is part of activity analysis in the web app on Free and Pro. You need an account and a recording with supported sensor samples. The available charts depend on the file, even when the account has access to the feature.
Related guides
All Pro features are free through January 31, 2027. No credit card or automatic charges. After Early Access, keep using Free or choose Pro. See Free and Pro plans.