You finish a familiar climb faster, but the total time does not show where the difference came from. Match two recordings along the road to see where the gap grew, what power you rode at and how your heart rate changed.
Screenshots show synthetic rides on the Bormio–Stelvio road in Italy, matched and calculated by the web app.
Start with a reference ride
Open a completed activity, choose More actions → Compare, then select another ride from Recent. The activity you opened stays the reference. You can compare up to five saved activities of the same sport, including that reference; a shared section compares the reference with one other recording at a time.
Manual comparison of saved activities is included in Free and Pro. Find similar can help locate candidates in your own history and is part of Pro. The route comparison works once you choose the recordings; it does not require an automatic similarity search.
Choose the road you want to compare
The comparison opens with Whole activities selected. Use the selector above the map to choose a Shared section. Its label includes the reference time and matched distance. You can also click a matched path on the map; the selector, highlighted route and comparison table update together.
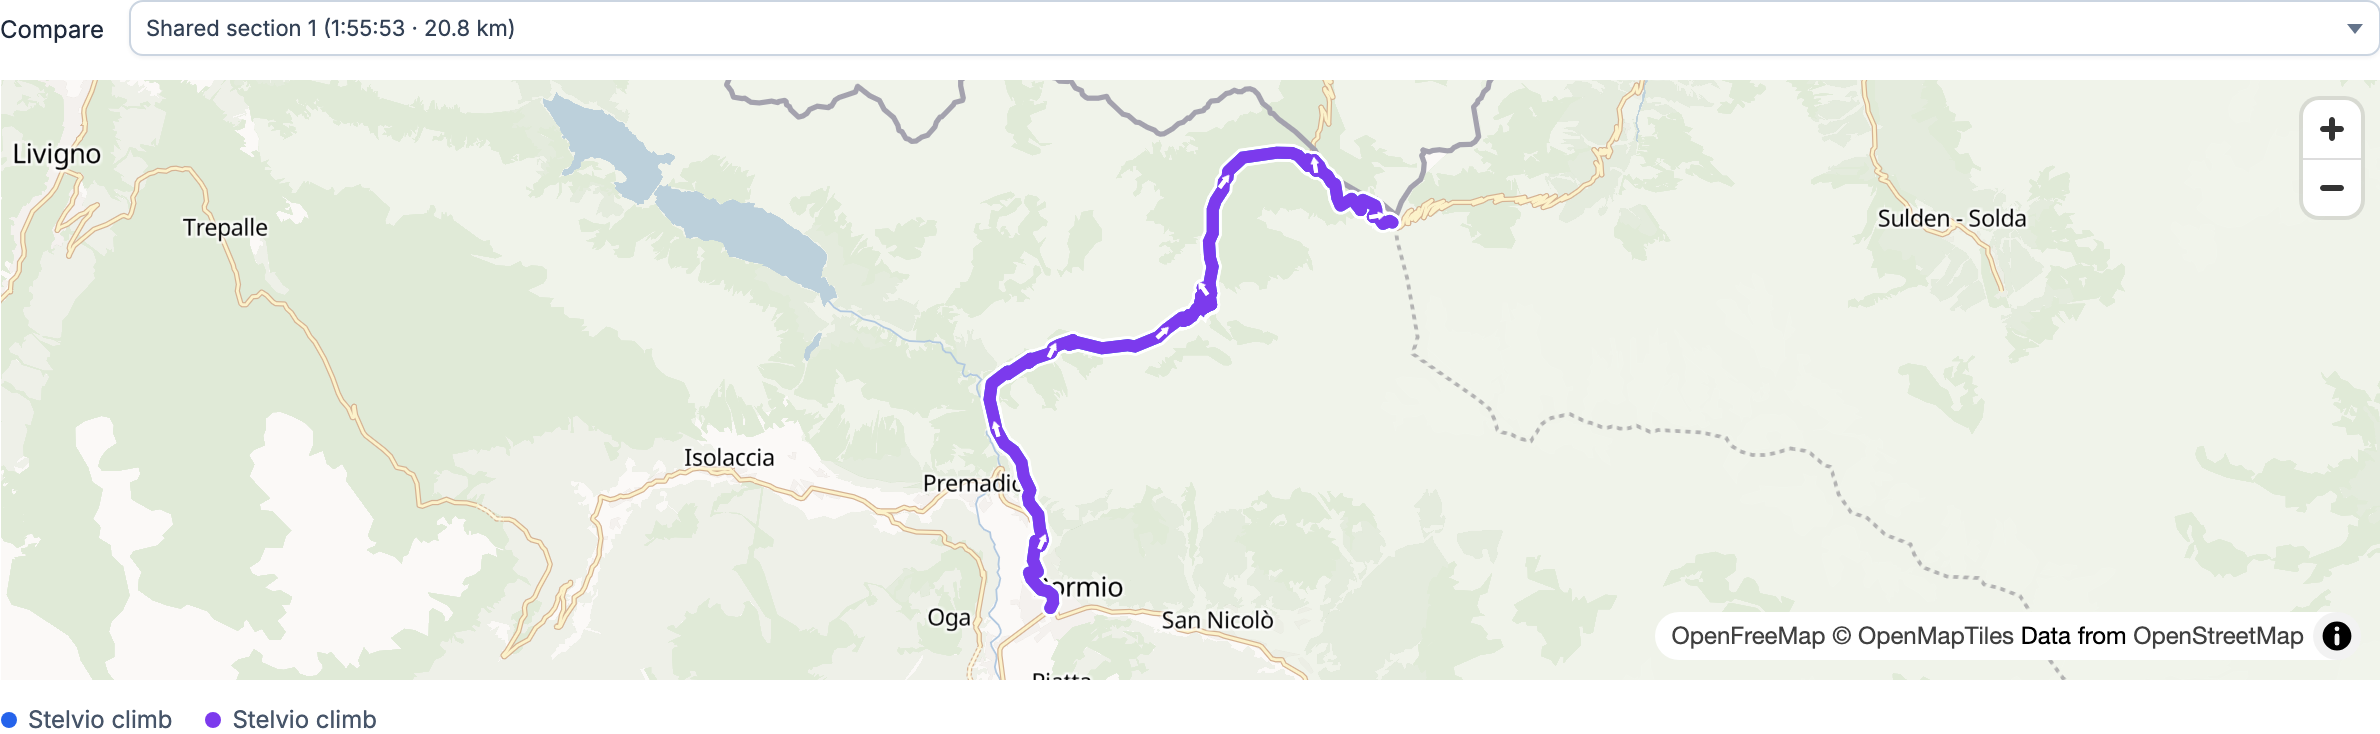
Shared sections must be at least 100 m long and follow the same direction. The rides can start in different places or continue beyond the shared road. Detours and GPS gaps can split an overlap into separate sections. A ride in the opposite direction does not qualify as the same timed section.
Read power and heart rate at the same place
Shared-section profiles use distance along the matched road. At any point on the horizontal axis, the readings describe the same part of the route even if you reached it at different elapsed times. Cycling shows power and heart rate when recorded; running comparisons can also show pace.
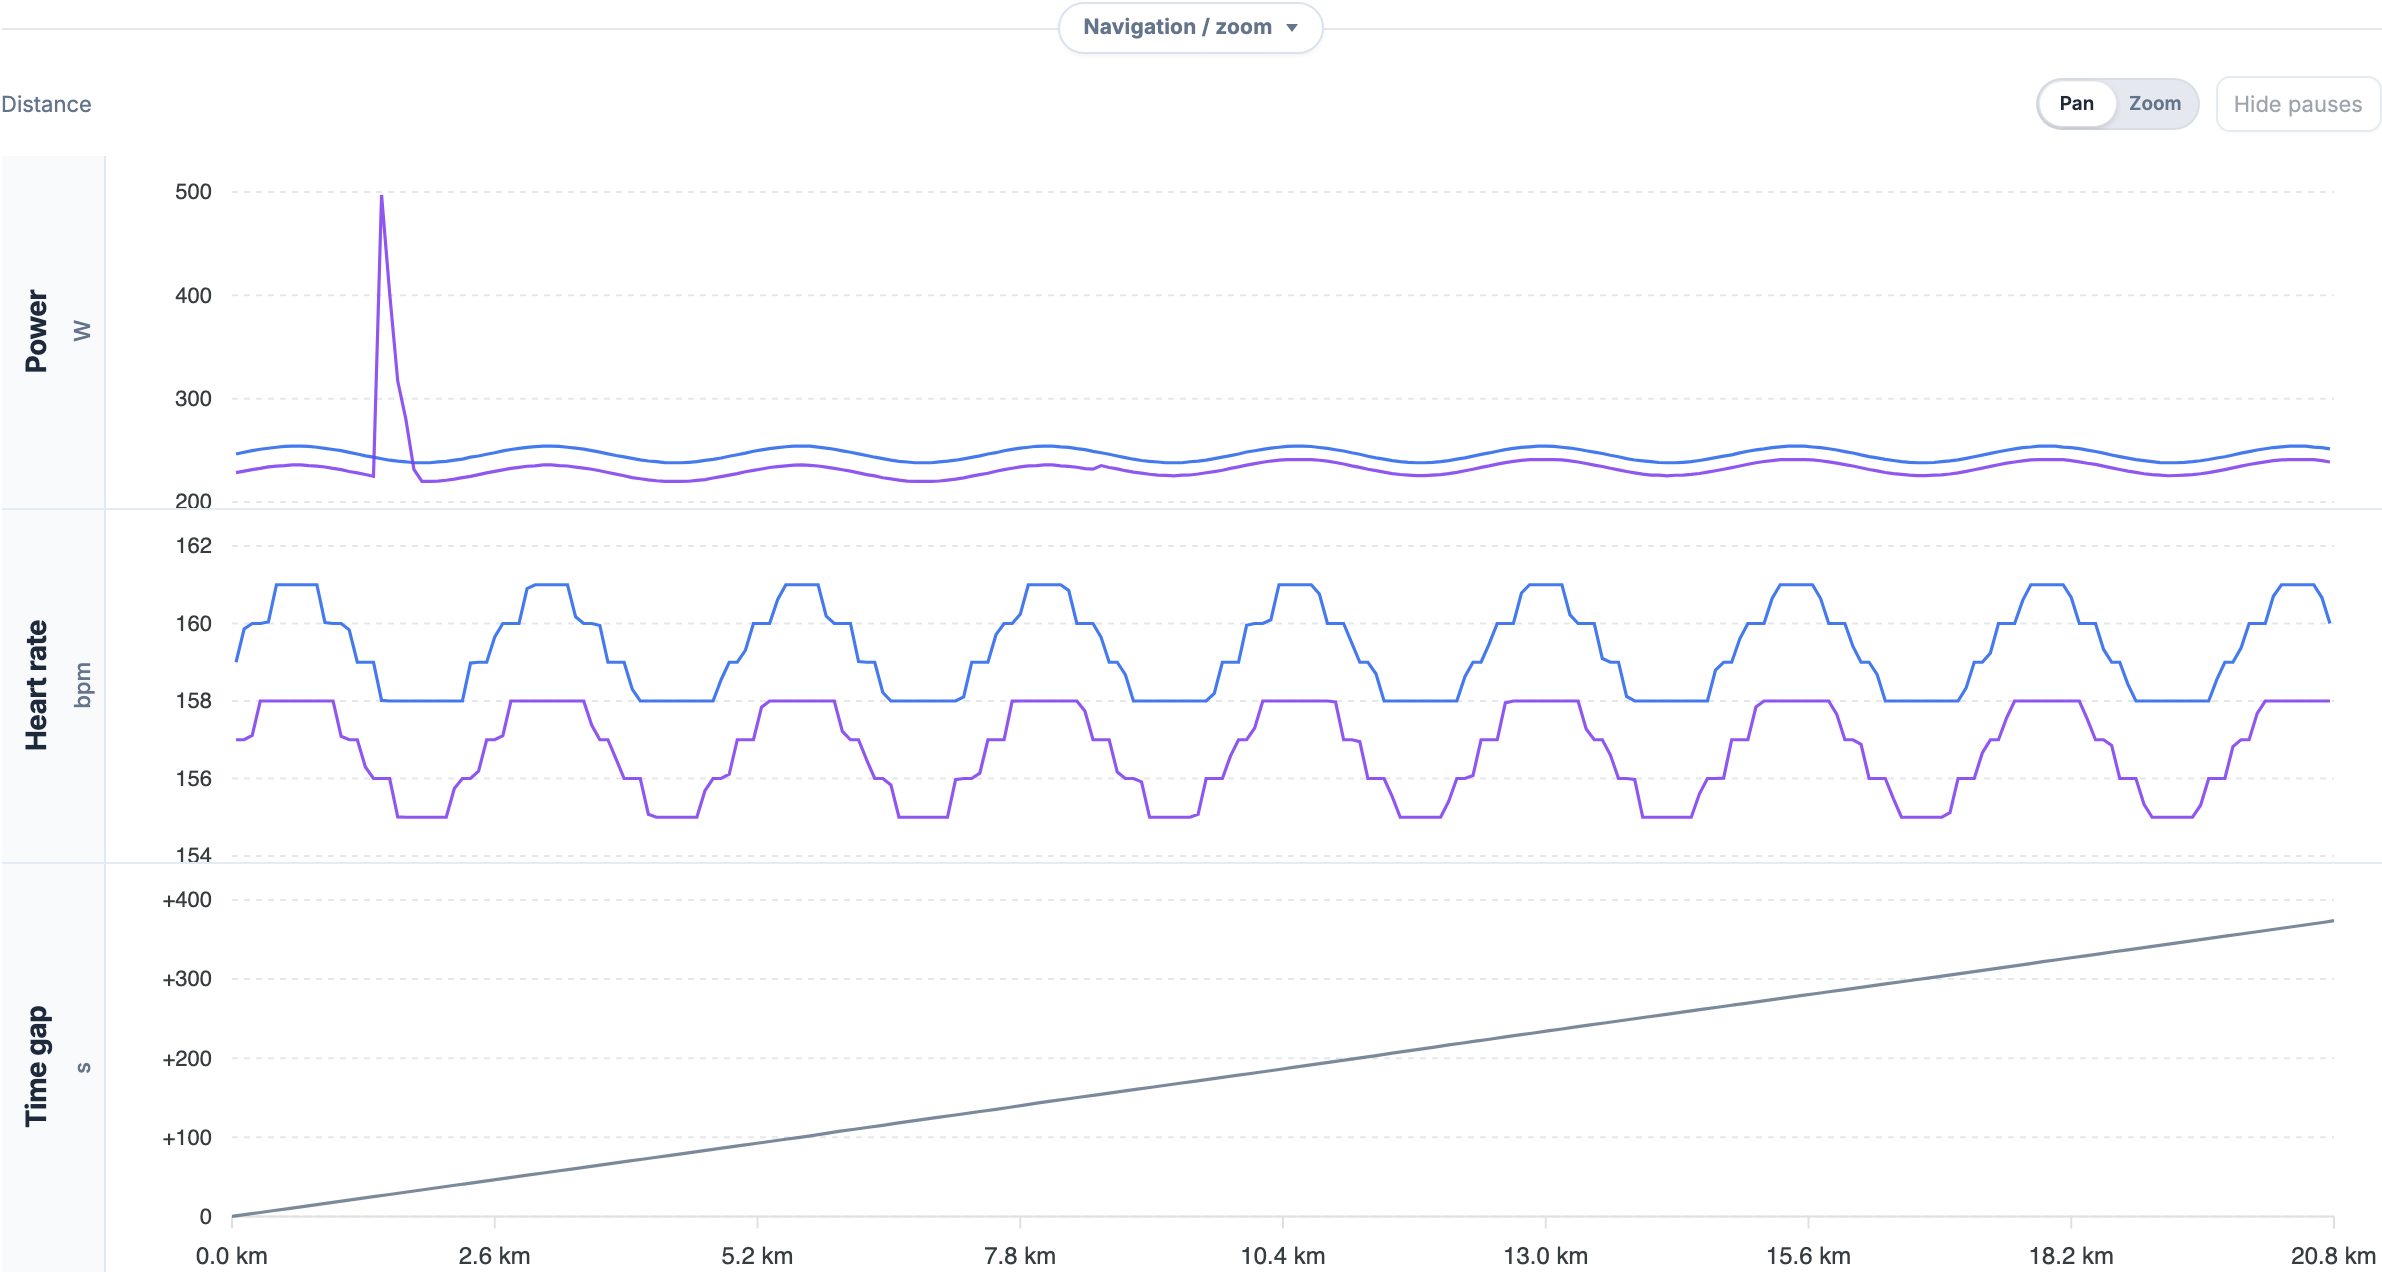
Pan, Zoom and Navigation / zoom control the profile stack together. A shared cursor keeps the readings aligned. Zoom into a change in the time-gap line, then inspect the power and heart rate around that distance. Chart values are time-weighted averages within distance bins; bins with less than 90% sensor coverage show gaps.
See where time was gained or lost
Time gap is the compared ride’s time minus the reference ride’s time at the same progress along the section. Negative means the compared ride was faster. For example, −30 s means it reached that point 30 seconds sooner; +30 s means it took 30 seconds longer. The gap starts at the beginning of the selected section, not at the start of either full ride.
A falling line means the compared ride is gaining time; a rising line means it is losing time. Read the change along the route as well as the final gap. Higher power can explain a harder effort, but the charts alone cannot separate the effects of fitness, wind, drafting, equipment or calibration.
Separate riding time from stops
Elapsed time includes stops. Hide pauses removes each recording’s stopped samples from the profiles and switches the time gap to moving time. The matched road and current zoom stay fixed. Show pauses restores the elapsed-time view.
This display control leaves table totals, CSV values and whole-activity duration curves unchanged. A sensor dropout is not a timer pause. Missing sensor readings remain gaps; recorded zero power still counts while the timer is running.
Compare the values for that section
The table below the profiles uses the selected section’s boundaries for both rides. Time, distance, speed, power, heart rate and other supported measurements describe that section. Both speeds use the same matched distance and elapsed time. Unsupported section metrics stay unavailable instead of taking values from the whole ride.
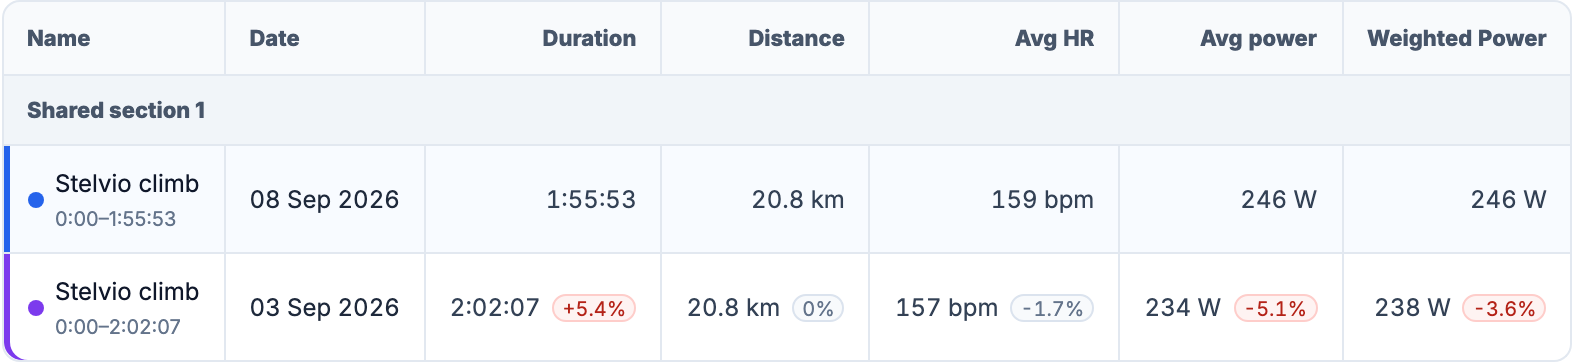
Settings lets you choose and arrange columns. Export CSV follows the selected scope and column order. Green marks faster time or higher speed or power; red marks the opposite. Heart rate, cadence and context-dependent metrics stay neutral. These colors describe the recorded comparison, not a verdict on your training.
Duration curves below the table still describe the complete activities. Their horizontal axis is effort duration, so they answer a different question from the distance-aligned profiles above.
Focus on a marked climb or interval
Matched segments from the reference activity appear under Marked segments in the selector. A segment must match completely. Its table and time gap use its own boundaries. Power and heart-rate profiles are available when that segment lies fully inside one shared section in both recordings.
Shaded ranges on the profiles mark the reference activity’s segments. Hover over a matched range to highlight it on the map without changing the selected comparison. To keep a repeat climb in a dedicated history, save it as a Private Segment.
When a route comparison is unavailable
Both recordings need usable GPS. Without it, or without a continuous shared section of at least 100 m in the same direction, the comparison explains why no route match is available. Whole-activity metrics and any recorded duration curves remain useful. Missing power or heart rate prevents that sensor profile from being shown.
GPS timing is approximate. Short recording deviations are tolerated, but nearby parallel roads can be indistinguishable. Review the highlighted route before interpreting a small time difference. Comparing routes reads existing recordings and does not rewrite their history.
A temporary FIT comparison is available in Pro for one same-sport file up to 64 MiB, labelled 64 MB in the interface. It uses the same route comparison when the file has suitable GPS, without adding the file to your activity history.
Related guides
All Pro features are free through January 31, 2027. No credit card or automatic charges. After Early Access, keep using Free or choose Pro. See Free and Pro plans.