Understand what a completed workout involved, how the effort was distributed, and where it fits into your recent training. AI Insights turns the available workout data into a short, readable analysis.
A real ride, a saved analysis
This example comes from Warszawa Granfondo 2026. The analysis was saved on September 23, 2026. The screenshots and text below reproduce the same four observations.
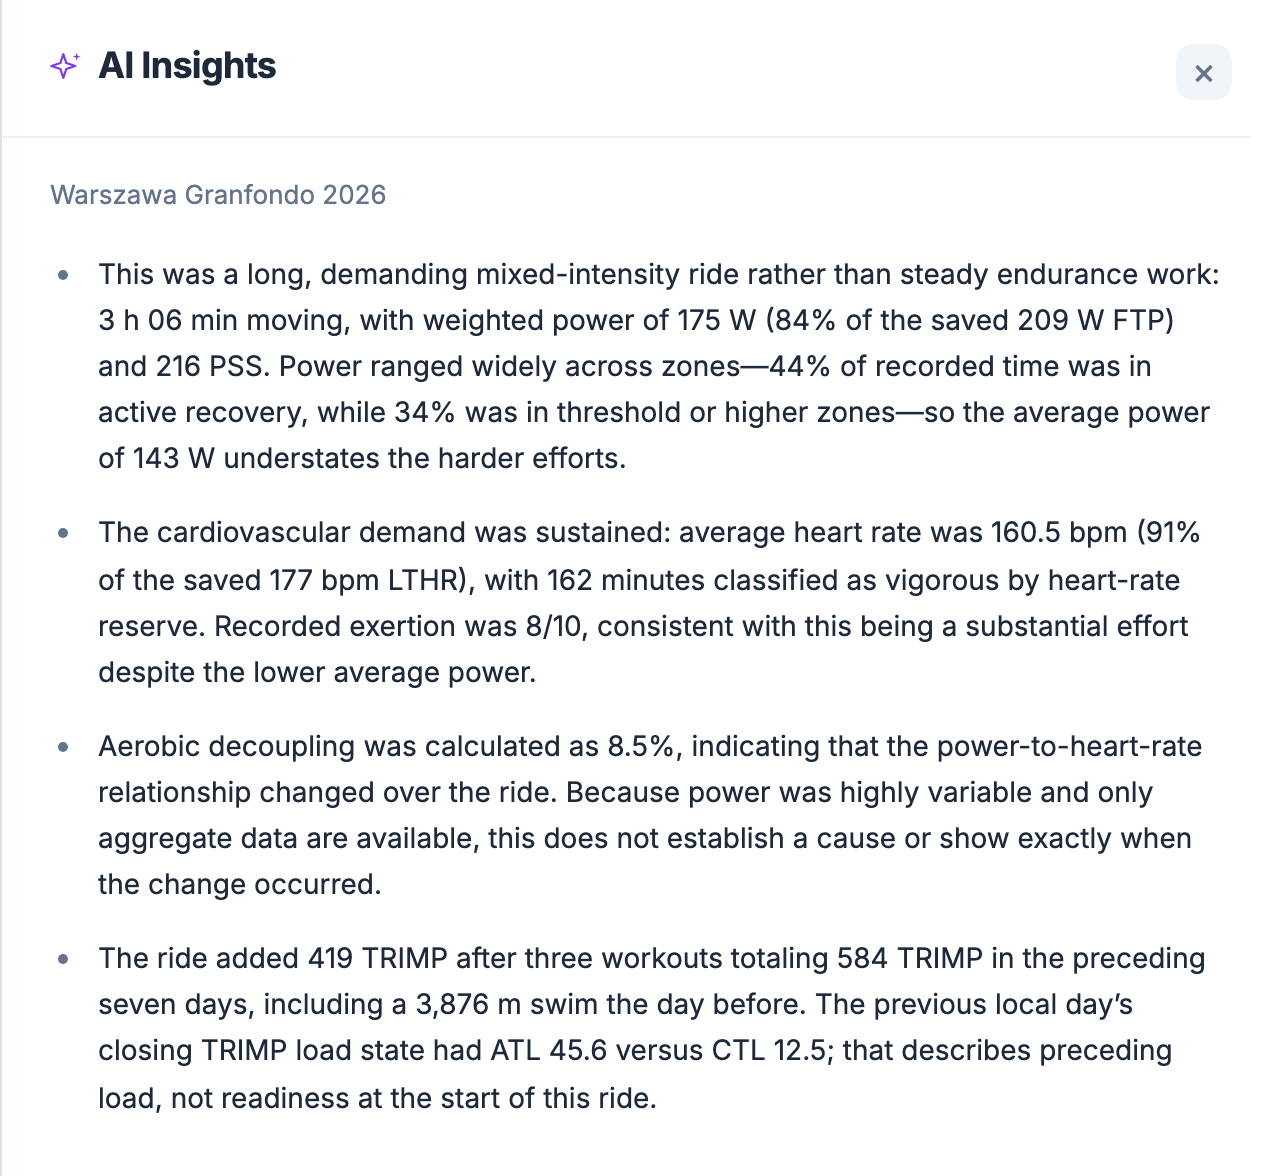
The four observations
- This was a long, demanding mixed-intensity ride rather than steady endurance work: 3 h 06 min moving, with weighted power of 175 W (84% of the saved 209 W FTP) and 216 PSS. Power ranged widely across zones—44% of recorded time was in active recovery, while 34% was in threshold or higher zones—so the average power of 143 W understates the harder efforts.
- The cardiovascular demand was sustained: average heart rate was 160.5 bpm (91% of the saved 177 bpm LTHR), with 162 minutes classified as vigorous by heart-rate reserve. Recorded exertion was 8/10, consistent with this being a substantial effort despite the lower average power.
- Aerobic decoupling was calculated as 8.5%, indicating that the power-to-heart-rate relationship changed over the ride. Because power was highly variable and only aggregate data are available, this does not establish a cause or show exactly when the change occurred.
- The ride added 419 TRIMP after three workouts totaling 584 TRIMP in the preceding seven days, including a 3,876 m swim the day before. The previous local day’s closing TRIMP load state had ATL 45.6 versus CTL 12.5; that describes preceding load, not readiness at the start of this ride.
What goes into the analysis
The workout comes first: duration, recorded effort, calculated metrics, intervals and laps, plus your notes and perceived effort where available. Power and heart rate describe different aspects of the session; PSS and TRIMP remain separate measures.
Recent training adds context from before the workout. The analysis can use the preceding 7 and 28 days, the previous day’s training-load state and available recovery measurements. A historical workout is interpreted against its own dated evidence and saved thresholds.
When available, a linked planned workout and its saved execution results help explain how the session compared with the plan. Already-found similar workouts can provide comparisons with earlier sessions. Missing context stays missing.
Open it from your workout
In the web app, open a completed workout from Activities and select AI Insights beside its title. The analysis opens in a side panel, so the recording remains close at hand.

On first opening, a new analysis is generated if none has been saved. Reopening the panel reads the existing answer. Closing it while analysis is running does not cancel the request; return to the workout to read the result.
Read the observations alongside the data
Missing sensor data or history limits the analysis. AI can help interpret the available measurements, but an observation is not a diagnosis or proof of a cause. The example’s aerobic decoupling describes a change in the relationship between power and heart rate; it cannot establish why it happened.
Use the workout charts and interval details to examine an observation more closely. Saved answers reflect the data available when they were generated; reopening a panel does not automatically rewrite an earlier analysis.
Explore workout charts and intervals
All Pro features are free through January 31, 2027. No credit card or automatic charges. After Early Access, keep using Free or choose Pro. See Free and Pro plans.