Two weeks can contain the same hours of training and very different effort. Training Volume lets you switch between time, heart-rate load and power-based load, then compare each week with your own recent history. The dates matter too: Thursday’s total is still only part of a week.
The screenshots show synthetic training history in the web app. Training Volume is included in Free and Pro.
Start with the number you want to compare
Open Dashboard → Training analytics → Training Volume. Each point is a weekly or monthly total for the selected metric and sport. The graph shows how those totals changed; Period Summary describes the whole selected window. On desktop the summary sits beside the graph; on a phone it follows below.
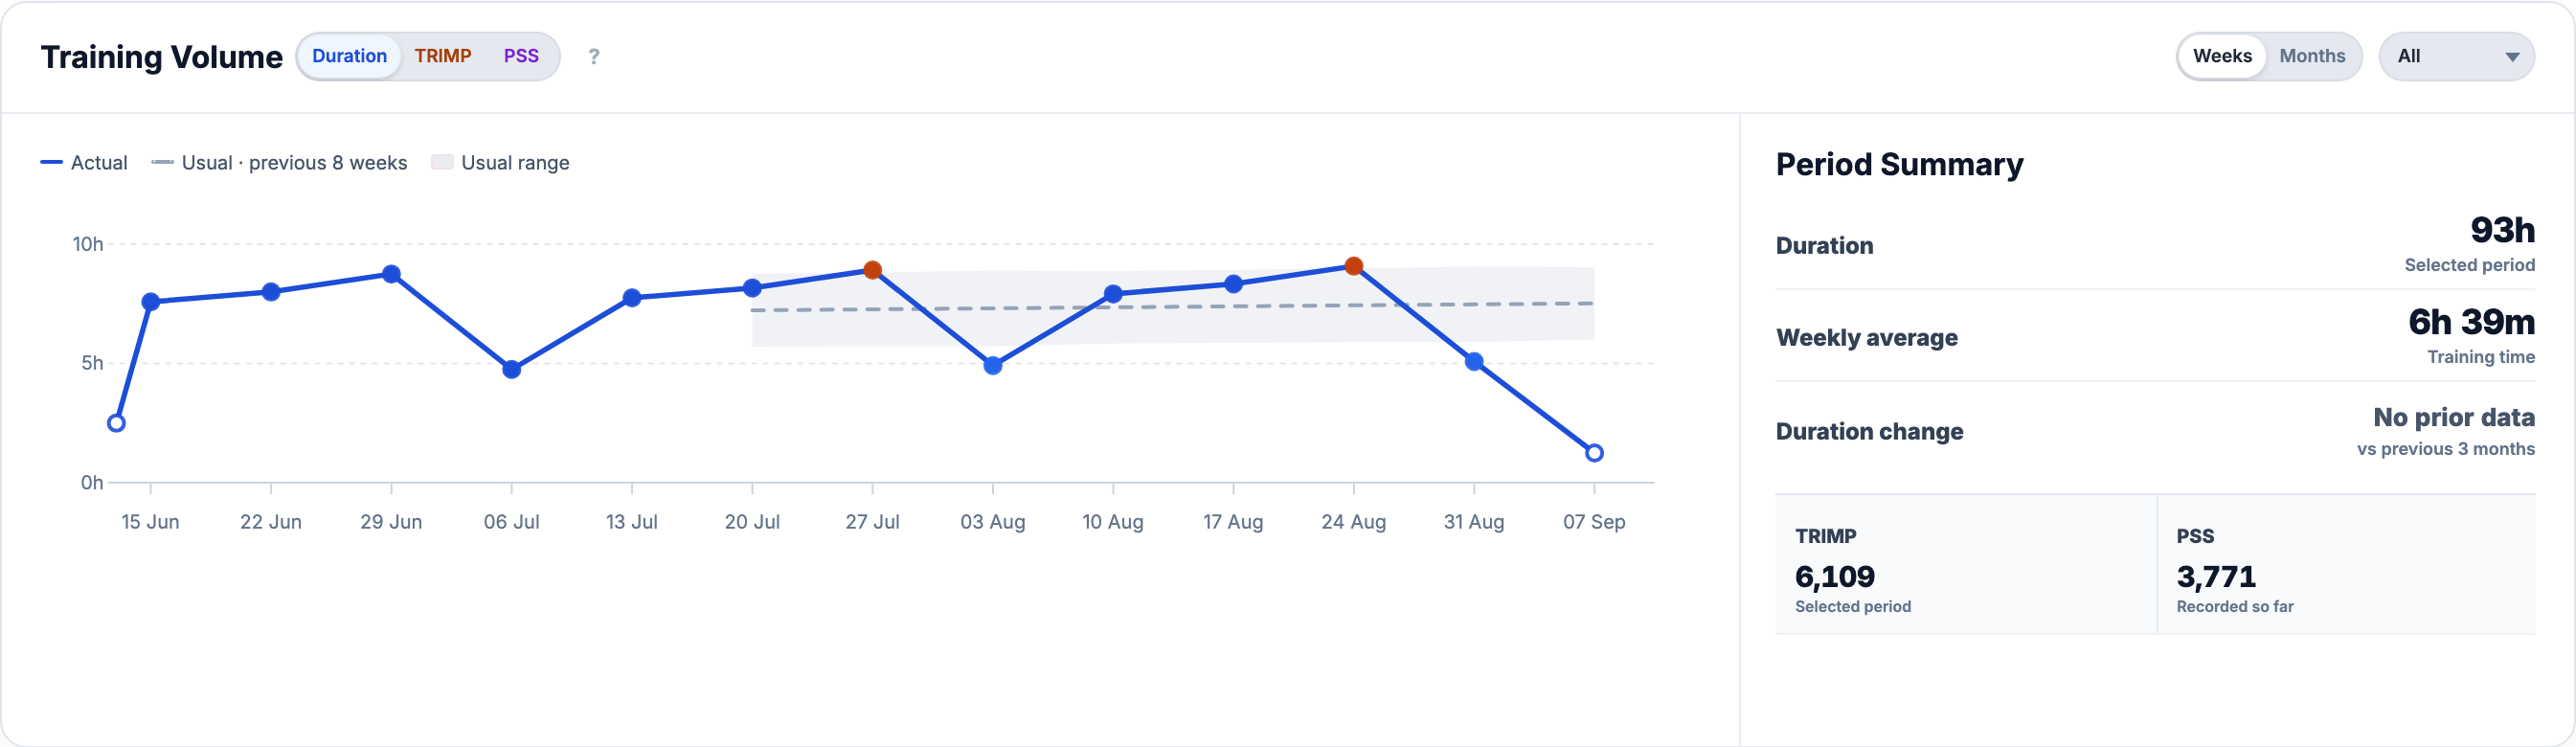
Duration adds elapsed activity time, including recorded pauses. A ride lasting 90 minutes from start to finish contributes 90 minutes even if its timer ran for only 80. This is why the volume total can differ from the timer duration used in a power-load calculation.
TRIMP adds the available heart-rate load from the selected activities. PSS adds their available power-based load, calculated from power, duration and the applicable FTP or running power threshold. They answer different questions: the same number of training hours can produce different TRIMP and PSS totals.
The selected metric keeps its own scale and units. Duration is blue, TRIMP orange and PSS purple. The circled ? beside the title opens definitions and links to the guides. Selecting PSS without usable power data leaves PSS unavailable; the chart does not quietly switch to TRIMP.
Choose the dates, grouping and sport
The date beside the Dashboard title sets the endpoint. Above Training analytics, 42D, 3M, 6M, 1Y and 2Y choose how much history to show. Training Load shares these dates. The Weeks/Months and sport controls inside Training Volume change only this chart and its summary.
Weeks follows your configured Calendar week start; Months uses calendar months. Activities belong to the period containing their local start date, using your account timezone. A session crossing midnight stays with its start day. Changing the grouping does not split or rewrite the recording.
All combines the recorded sports. The dropdown also lists the sports present in the selected dates, including sessions without heart-rate or power data. Choose Swimming to combine pool and open-water time. If a sport is absent, check the selected dates. The Swimming Analytics example shows that filtered view.
Compare a week with your own recent pattern
Weekly mode includes a dashed Usual line and a shaded Usual range when enough history is available. For each point, they use the eight immediately preceding complete weeks of the same metric and sport. The evaluated week does not enter its own baseline. A complete rest week counts as zero; an incomplete week cannot be replaced with an older one.
Usual is the mean of those eight totals. The band extends one population standard deviation below and above it, with a lower limit of zero. The calculation divides the sum of squared deviations by 8. A steadier history makes a narrower band; a more varied history makes a wider one.
For example, eight weeks of 4, 5, 6, 5, 4, 5, 6 and 5 hours have a mean of 5 hours and a usual range of about 4h 18m–5h 42m. A complete 6-hour week is above that range: 1 hour, or 20%, above the mean. These are illustrative inputs, separate from the screenshot data.
Hover or touch an actual point to see its dates, values and comparison. Orange above-range and blue below-range points indicate direction, not good or bad training. Values exactly on either boundary are within the range. This is a description of your recorded pattern, not a prescribed training target. The Usual Volume reference gives the full formula.
Check the included dates before reading a drop
A hollow point marks an unfinished or truncated period. The tooltip names both the calendar period and the dates actually included. Week in progress means the current week is still underway; Partial period can also appear at either edge of the selected window. Even a week ending today remains unfinished until that local day ends.
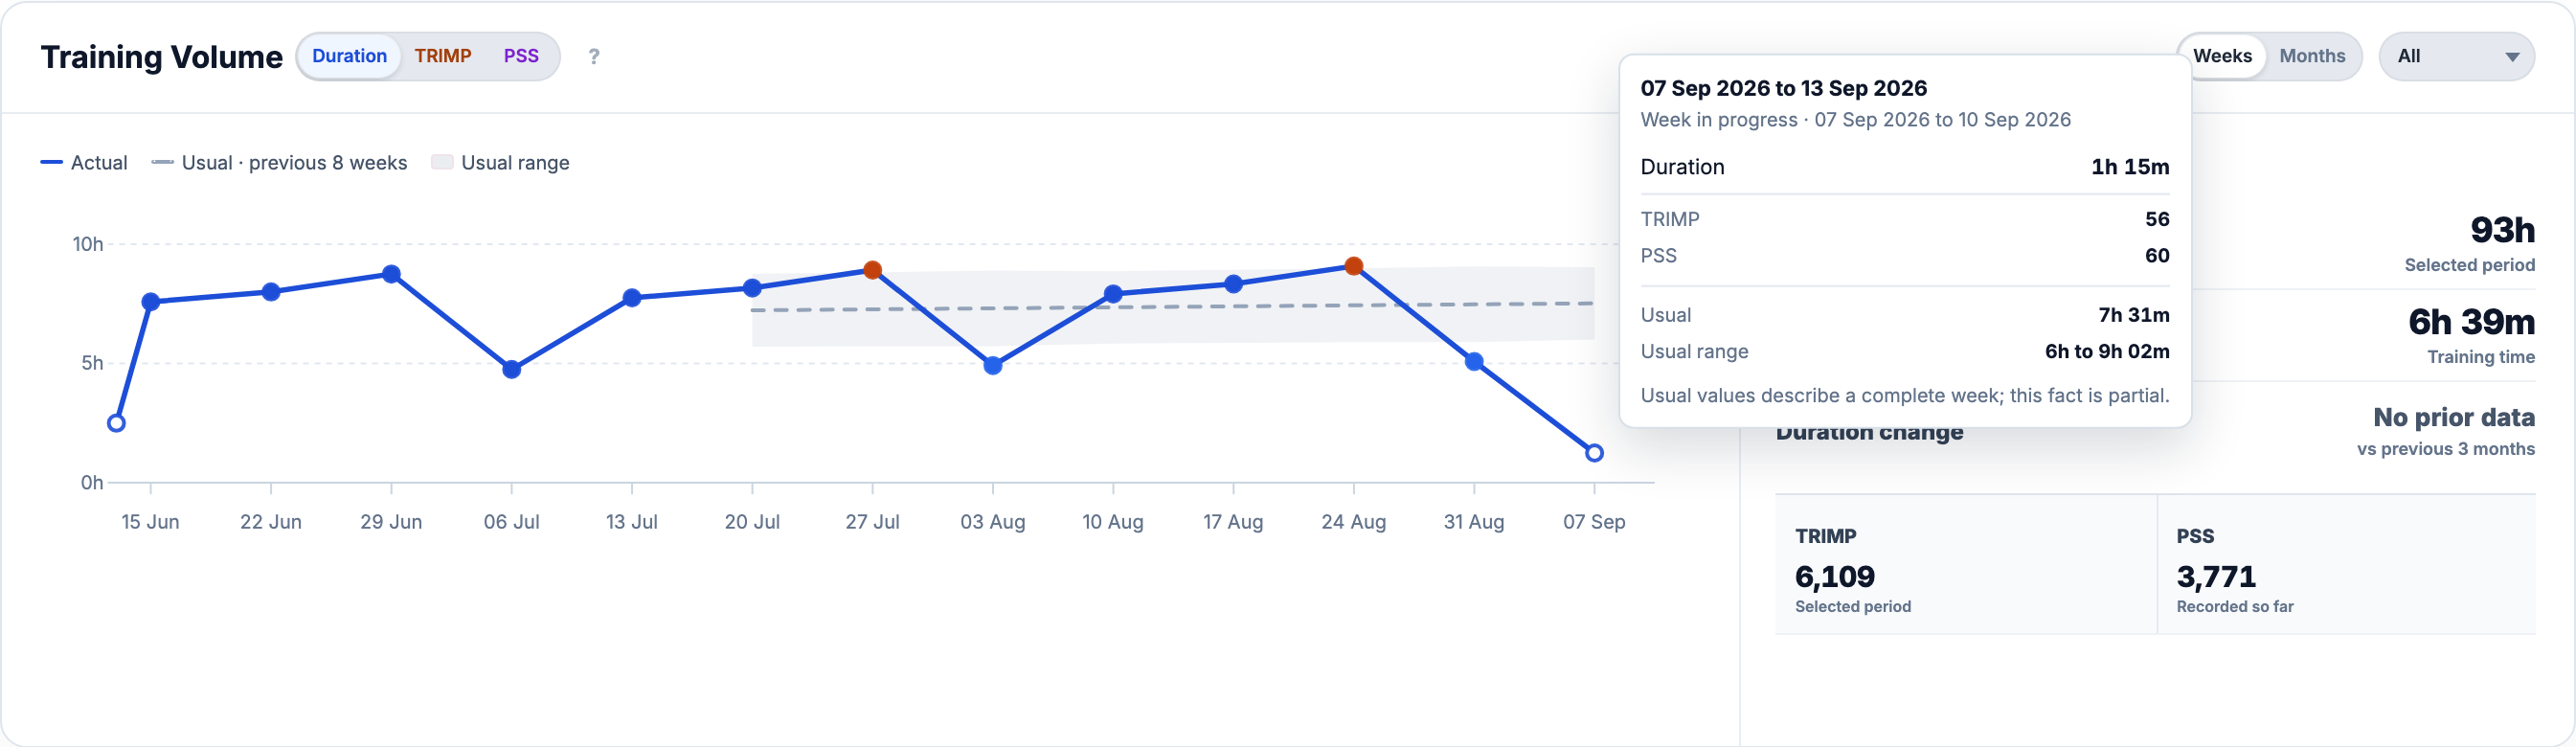
The usual line can still provide context for a partial point, but no completed-week difference or above/within/below status is assigned. Months shows calendar totals without the weekly usual line or band. A partial month still contains only the included dates, not a forecast for the rest of the month.
Keep the period summary separate from one point
Period Summary follows the selected dates, sport and metric even while you inspect a point. It shows the total, a weekly or monthly average and the change from the preceding interval of the same length. The other two metrics remain below as context.
Weekly average divides the total by weeks with activities in the selected sport, including partial weeks. Empty weeks do not dilute this average. For example, 20 hours recorded across four active weeks in a six-week window gives 5 hours per active week. This differs from the usual-range baseline, which includes all eight consecutive complete weeks, including rest weeks.
Monthly average uses the calendar months touched by the selected window. No prior data means the preceding comparison is unavailable, not that its total was zero. Incomplete history or metric coverage can also make a comparison unavailable while leaving the recorded total visible.
Check coverage before calling a week lighter
A swim or run can contribute Duration without usable TRIMP or PSS. If only some sessions have the selected load metric, their available values still add up, but the period is incomplete for that metric. The summary reports how many activities supplied it. Missing values do not become zero, and PSS does not fill gaps in TRIMP.
A confirmed rest week remains a real zero on the chart. Time before imported history begins is unknown. Check missing recordings and sensor coverage before interpreting a low total as recovery. Adding older activities or correcting dates, sport or applicable thresholds can change the totals and their comparisons.
Training Volume sums recorded work by period. Training Load shows how daily TRIMP accumulates into CTL, ATL and TSB. Use Progress to compare two periods or seasons, and Activity Analysis to inspect the recording behind a total.
All Pro features are free through January 31, 2027. No credit card or automatic charges. After Early Access, keep using Free or choose Pro. See Free and Pro plans.