A quieter week, a strong workout and a high Readiness score can all appear at once. Training Trends puts these observations beside your longer history, so you can see what changed and choose which part of your training to examine next.
The examples use synthetic training and health data, viewed as of 10 September 2026.
Start with the date you want to understand
In the web app, open Dashboard. The date beside the page title is the endpoint for the overview: Signals, Readiness and both training charts refer to that selected date. Choose an earlier day to revisit your history; Today brings the page back to the current day.
The Training analytics control selects 42D, 3M, 6M, 1Y or 2Y of history for Training Load and Training Volume. Here, 3M makes the recent week visible against a longer stretch of training. It changes those charts and the period summary; individual signals and Readiness keep their own named comparison windows.
Follow recent activity and changes in load
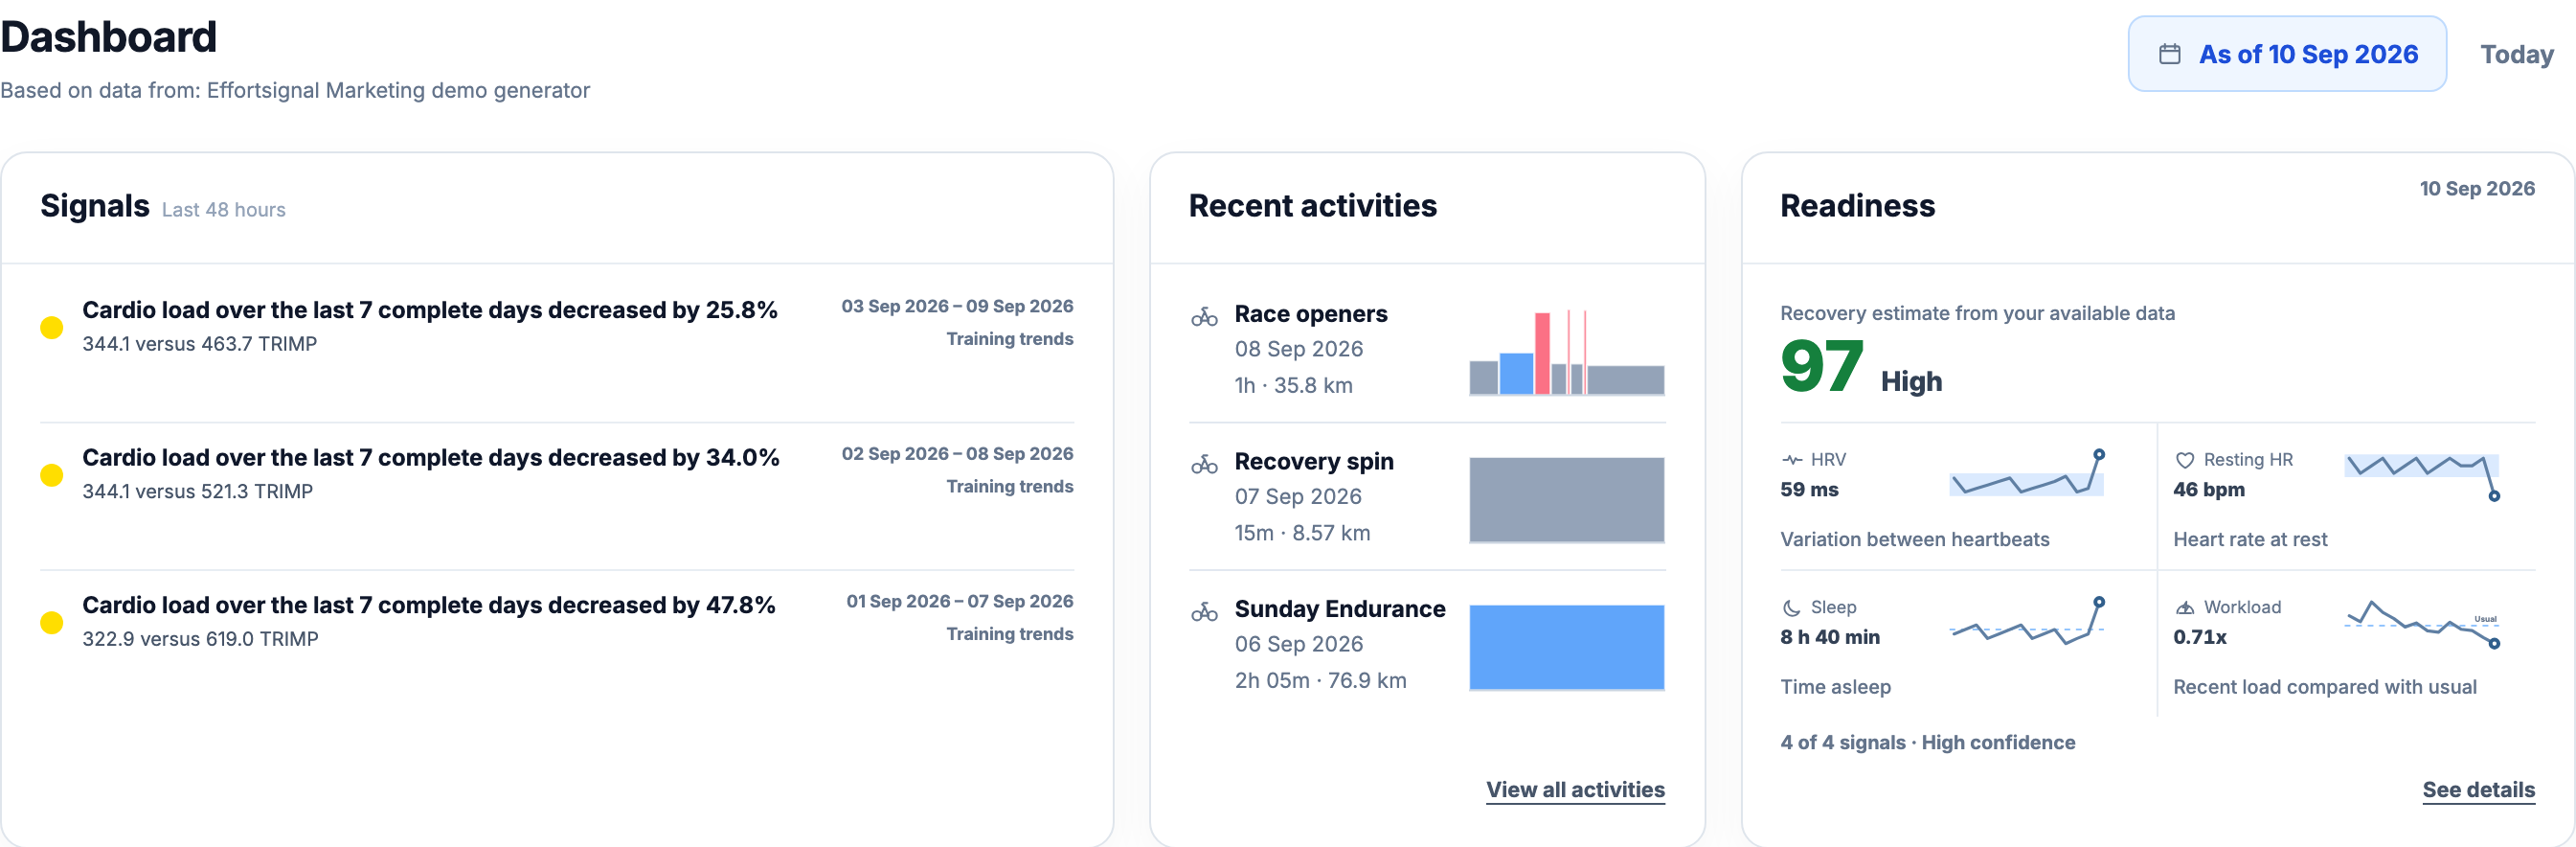
Recent activities lists the latest recordings with their date, duration and a small chart. Open an activity to inspect its details. Signals adds context from your training history: the latest cardio-load observation compares 344.1 versus 463.7 TRIMP over two sets of seven complete days.
Signals surfaces up to three observations, with their values and dates. Read the named period before comparing a signal with another panel: a 90-day power best and a seven-day load change answer different questions. The Useful Signals guide explains which changes qualify and what history they require. A quiet card can mean no qualifying change; a message about collecting a baseline or unavailable data means the evidence is not ready yet.
Beside those observations, Readiness is 97, High, with all four factors available: HRV, resting heart rate, sleep and workload. The coverage and confidence line helps you judge how much evidence is behind the result. This score does not establish why the week was lighter or prescribe the next workout.
Select See details on the Readiness card to open its dedicated history page. Choose a preset period or custom dates, then inspect each metric beside its daily graph. That is the place to inspect a recovery measurement more closely. The Recovery and Readiness guide explains its personal baseline and missing-data rules.
Put the recent week against the longer trend
The Training Load chart answers the next question: how does that quieter week fit into the preceding months? In this example, the blue Fitness (CTL) line rises gradually across the selected history. Near the right edge, the pink Fatigue (ATL) line falls more quickly and ends below it. Recent workload has eased while the longer-term load estimate still reflects earlier training.
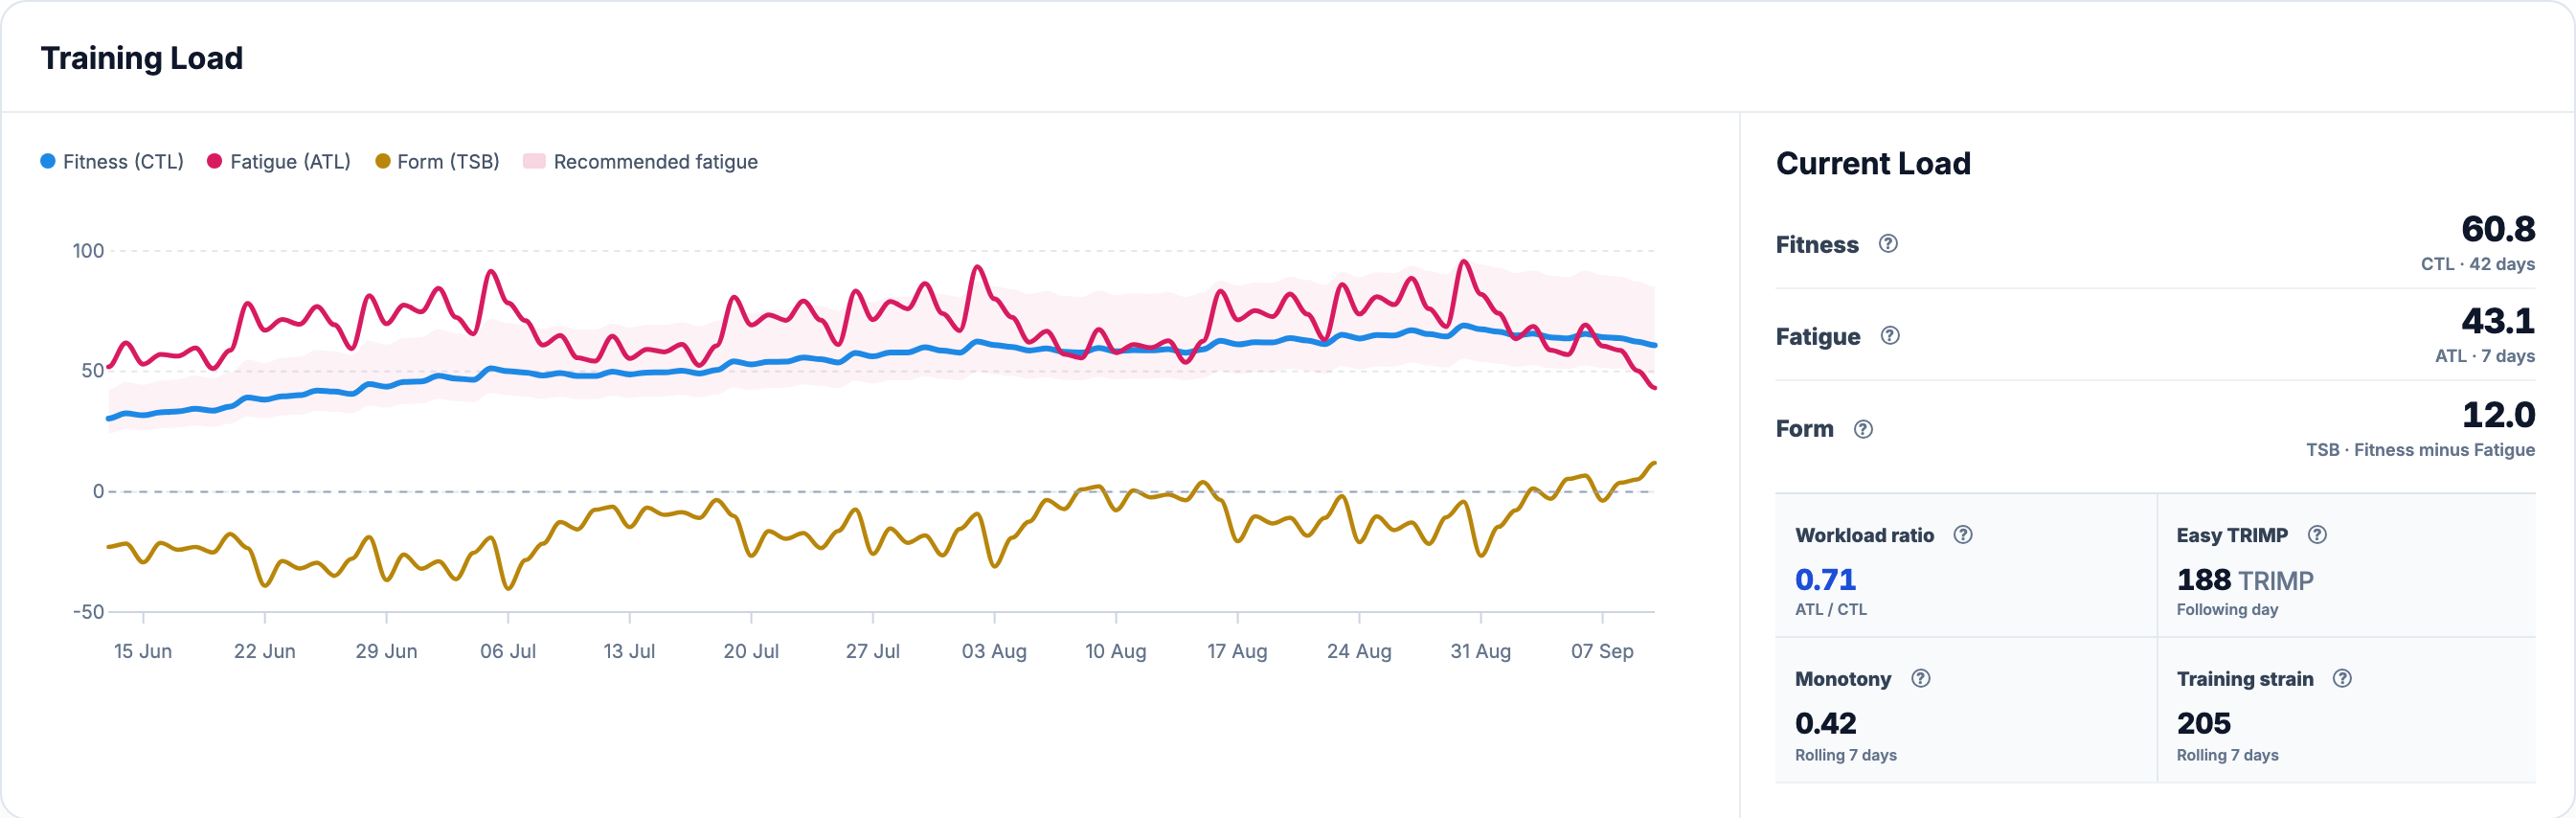
CTL uses a 42-day model and ATL a seven-day model of daily heart-rate load. Their names are workload estimates, not direct measurements of fitness or how tired you feel. Form (TSB) uses the preceding day’s completed CTL and ATL, which is why it is not simply the subtraction of the two updated values beside it.
Current Load also keeps Workload ratio, Easy TRIMP, Monotony and Training strain next to the graph. These add context about recent load and its distribution; they are not additional measurements from your body. For their meaning and the chart’s shaded range, continue to Training Load. The ACWR guide follows Workload ratio from Dashboard into Calendar and Week Details. The TSB guide explains the previous-day Form calculation through a lighter training week.
Check whether the week is finished
Training Volume lets you look at the same history as Duration, heart-rate load (TRIMP) or power-based load (PSS). Weeks and Months choose the grouping. The sport selector offers All, Ride, Run and Others, so you can inspect one part of a mixed training history.
In weekly mode, the dashed usual line and shaded range come from the previous eight complete weeks. Hover over a point, or tap it on a phone, to see its dates and values. The last point here represents the week of 7–13 September, but the selected endpoint only includes 7–10 September.
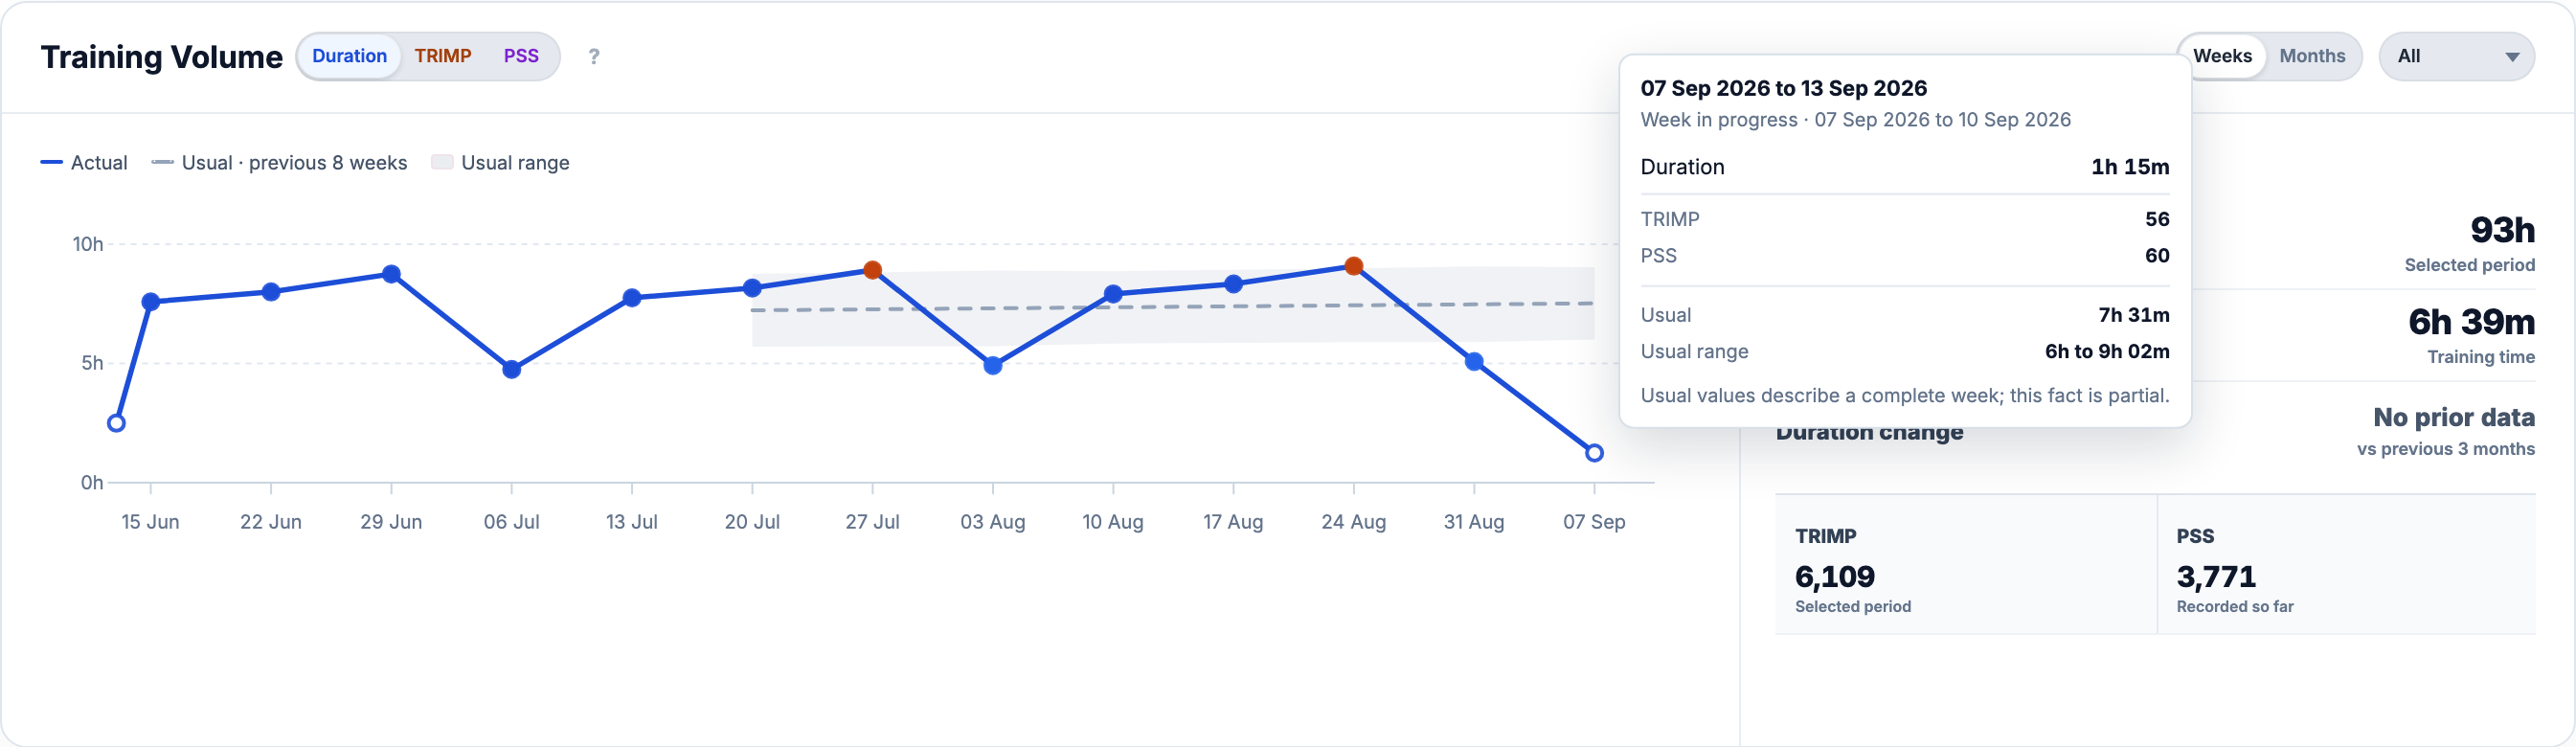
Period Summary continues to describe the selected history, even while a point’s details are open. Here it totals 93h with a 6h 39m weekly average. No prior data in the change field means the earlier comparison period is unavailable; it does not mean the current total is zero. Monthly grouping gives a broader view without the weekly usual-range comparison.
Duration needs recorded training time. TRIMP needs usable heart-rate data; PSS needs recorded power and an FTP value. Switching the metric can therefore change which sessions contribute usable values. The Training Volume guide and usual-volume calculation cover the comparisons and incomplete periods in more detail.
Take the next question to the right view
Dashboard gives you an overview. To inspect a particular recording behind a change, open Activities and use Activity Analysis. To compare two periods or seasons, open Progress. Use Training Calendar to see how sessions were distributed and what was planned.
The training overview is available on Free. What appears depends on the activity and daily health history you have imported: a new account first needs data, and Readiness needs enough personal baseline history. Imported summaries can populate totals before detailed processing finishes. Missing sensor data, an unfinished calculation and a temporary request failure are different states; none should be read as a measured zero. A failed panel offers Try again.
The Learn catalog explains the individual calculations. Current plan terms are on the pricing page.
All Pro features are free through January 31, 2027. No credit card or automatic charges. After Early Access, keep using Free or choose Pro. See Free and Pro plans.