A hard ride moves recent load quickly. A lighter week lets it fall while the longer training history changes more slowly. Training Load puts those two timescales on one graph, so you can follow a training block and inspect the days behind it.
The screenshots show synthetic training history in the web app. Training Load is included in Free and Pro.
Start with the graph and Current Load
Open Dashboard and scroll to Training analytics → Training Load. On desktop, the history is on the left and Current Load is on the right. On a phone, the summary follows the graph. Its three main values are Fitness (CTL), Fatigue (ATL) and Form (TSB).
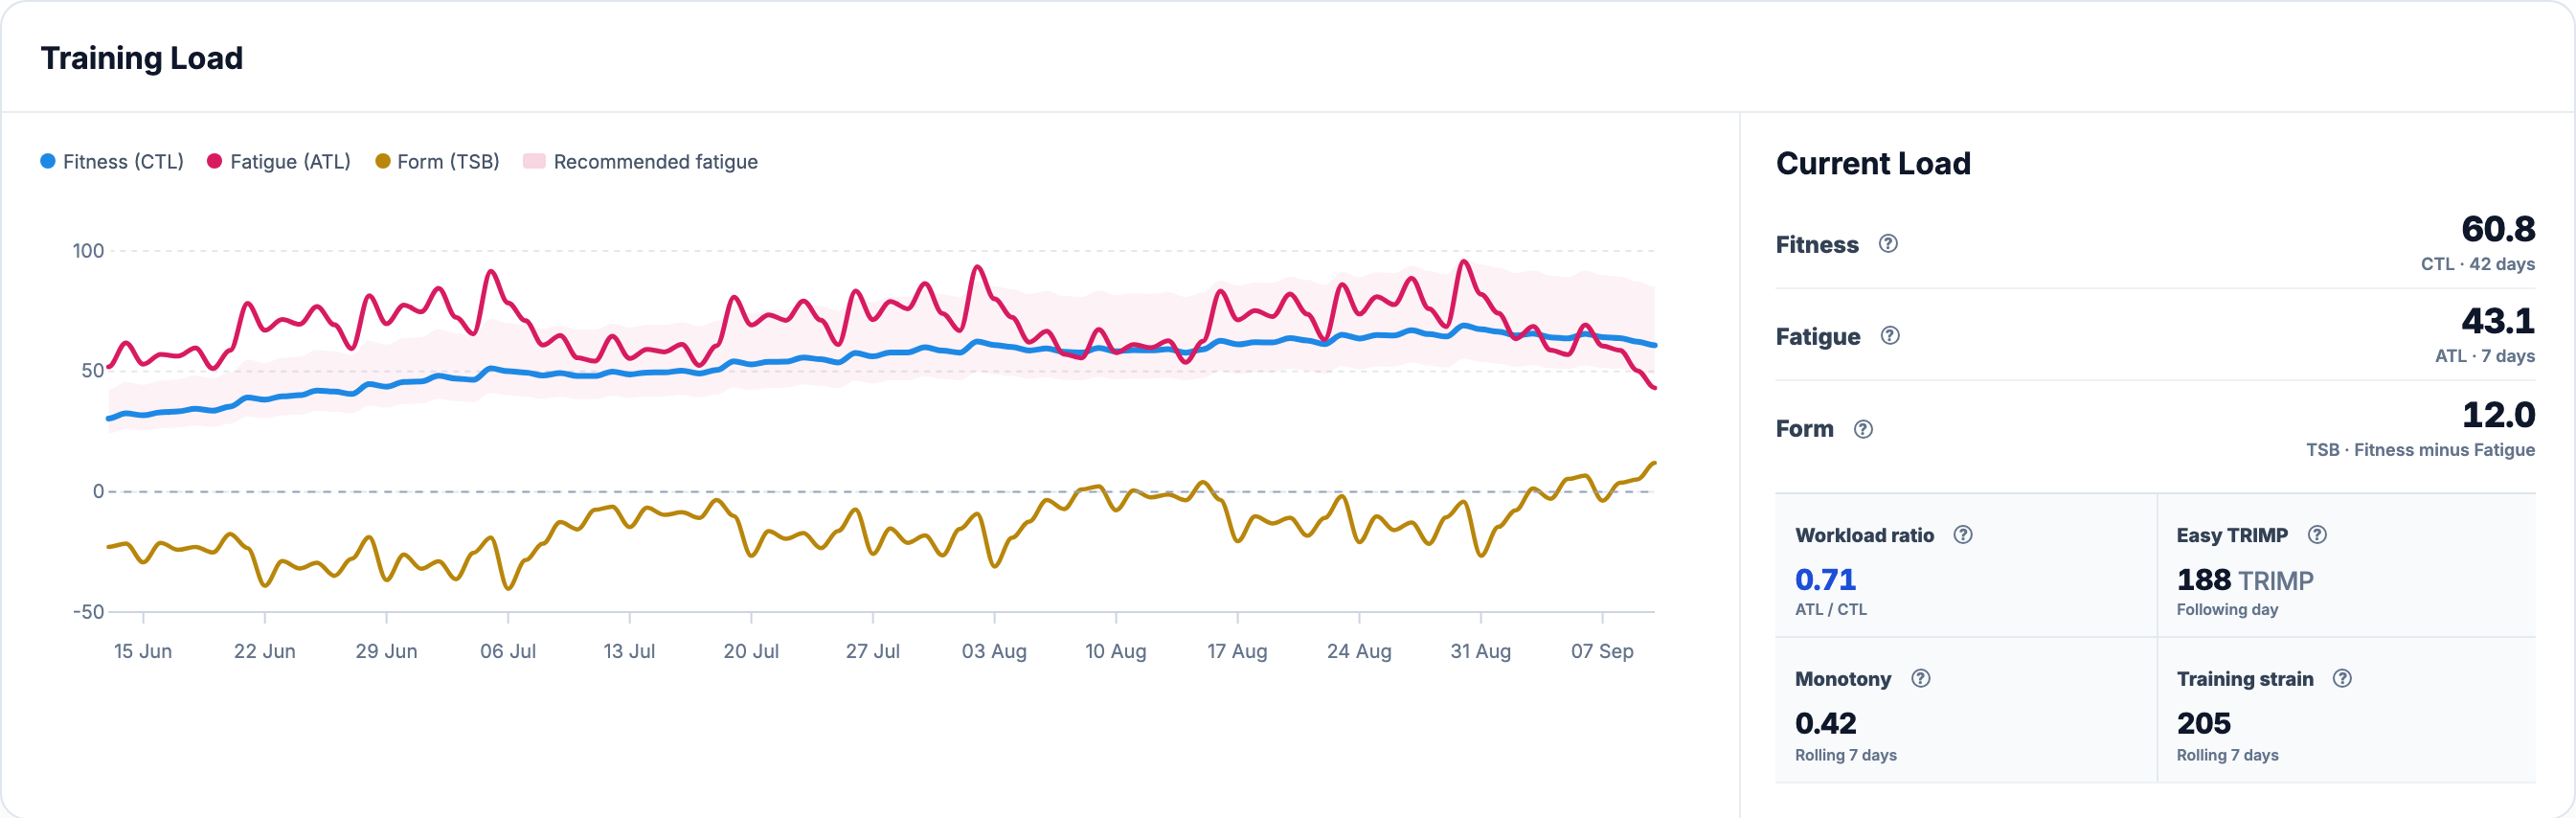
Hover over a measured line, or touch it on a phone, to see the date and values together. Use the legend to identify each metric: a steep ATL peak and a gradual CTL rise describe different parts of the same history. The summary stays tied to the selected endpoint while you inspect the graph.
Choose the date, then the amount of history
The date control beside the Dashboard title sets the endpoint. Choose an earlier date to revisit a training block; Today returns to the present. Above Training analytics, 42D, 3M, 6M, 1Y and 2Y change the visible window for both Training Load and Training Volume.
These controls change what you see, not how the model is calculated. Selecting 42D does not restart CTL, and selecting 2Y does not turn ATL into a two-year average. The sport and Duration/TRIMP/PSS controls inside Training Volume belong to that separate chart.
One daily input, two different response speeds
Completed activities contribute TRIMP, a cardiovascular load estimate based on duration, heart rate and your applicable HR settings. We add the available TRIMP from activities starting on each local calendar day. A morning run and an evening ride both contribute. Pool and open-water swimming count when their heart-rate data supports the calculation.
PSS measures power-based load separately. It does not fill a gap in TRIMP, and Training Load has no switch to replace this heart-rate history with PSS. A ride with power but unusable HR can still have PSS while its contribution to this graph is incomplete.
ATL uses a 7-day time constant and responds quickly. CTL uses a 42-day time constant and changes more slowly. Both are exponentially weighted averages: older training fades gradually instead of disappearing at a fixed cutoff. With L as the daily TRIMP total, the updates are:
ATL[d] = ATL[d−1] + (L[d] − ATL[d−1]) / 7
CTL[d] = CTL[d−1] + (L[d] − CTL[d−1]) / 42
TSB[d] = CTL[d−1] − ATL[d−1]
TSB uses the previous day’s CTL minus ATL. It describes the balance entering the labelled day, before that day’s training. This is why subtracting the two current values in the summary may not give the displayed TSB.
For a simple calculation example, start with ATL 60 and CTL 50. A day containing 100 TRIMP raises ATL to 65.7 and CTL to 51.2; TSB for that day remains −10. A following rest day lowers ATL to 56.3 and CTL to 50.0, while TSB becomes −14.5. The rest day has reduced the averages; its effect on the labelled TSB appears one day later.
Read the smaller numbers beside the graph
Workload ratio divides the selected day’s ATL by CTL. For example, ATL 60 and CTL 50 give 1.20. Unlike TSB, it includes the selected day’s load. If CTL is zero, the ratio is unavailable. Open the circled ? beside a metric for its calculation and limitations; close the panel with × or Escape.
The shaded recommended ATL range spans 0.8–1.4 × CTL once at least 14 days of history are available and CTL is positive. It moves with CTL. This band and the Workload ratio colour categories have different boundaries; neither establishes a safe training dose or an injury probability.
Easy TRIMP estimates the following day’s load that would equalise the next updated ATL and CTL. It is clamped to zero when the algebra gives a negative result. “Easy” refers to model balance, not how a ride will feel. It is not a workout target, and zero does not promise that one rest day will restore balance.
Monotony describes how similar the daily loads were over the rolling 7 days, including rest days. Training strain combines that variation with their total TRIMP. Compare these values with your own history: a repeated low-load week and a repeated high-load week can have similar monotony but very different strain.
Training Load also affects Readiness: the ATL/CTL workload ratio contributes to the score alongside HRV, resting heart rate and sleep, when enough load history is available. A high recent load relative to your longer-term level can lower Readiness.
The separate guides explain Workload ratio, Easy TRIMP and Monotony and Training Strain in more detail.
Bring the graph back to a training week
Open Calendar and select a week’s summary to open Week Details. The Training load section puts ATL, CTL, TSB and Workload ratio beside training time, with a daily ATL/CTL graph underneath. You can then return to the calendar and open the activities that contributed.
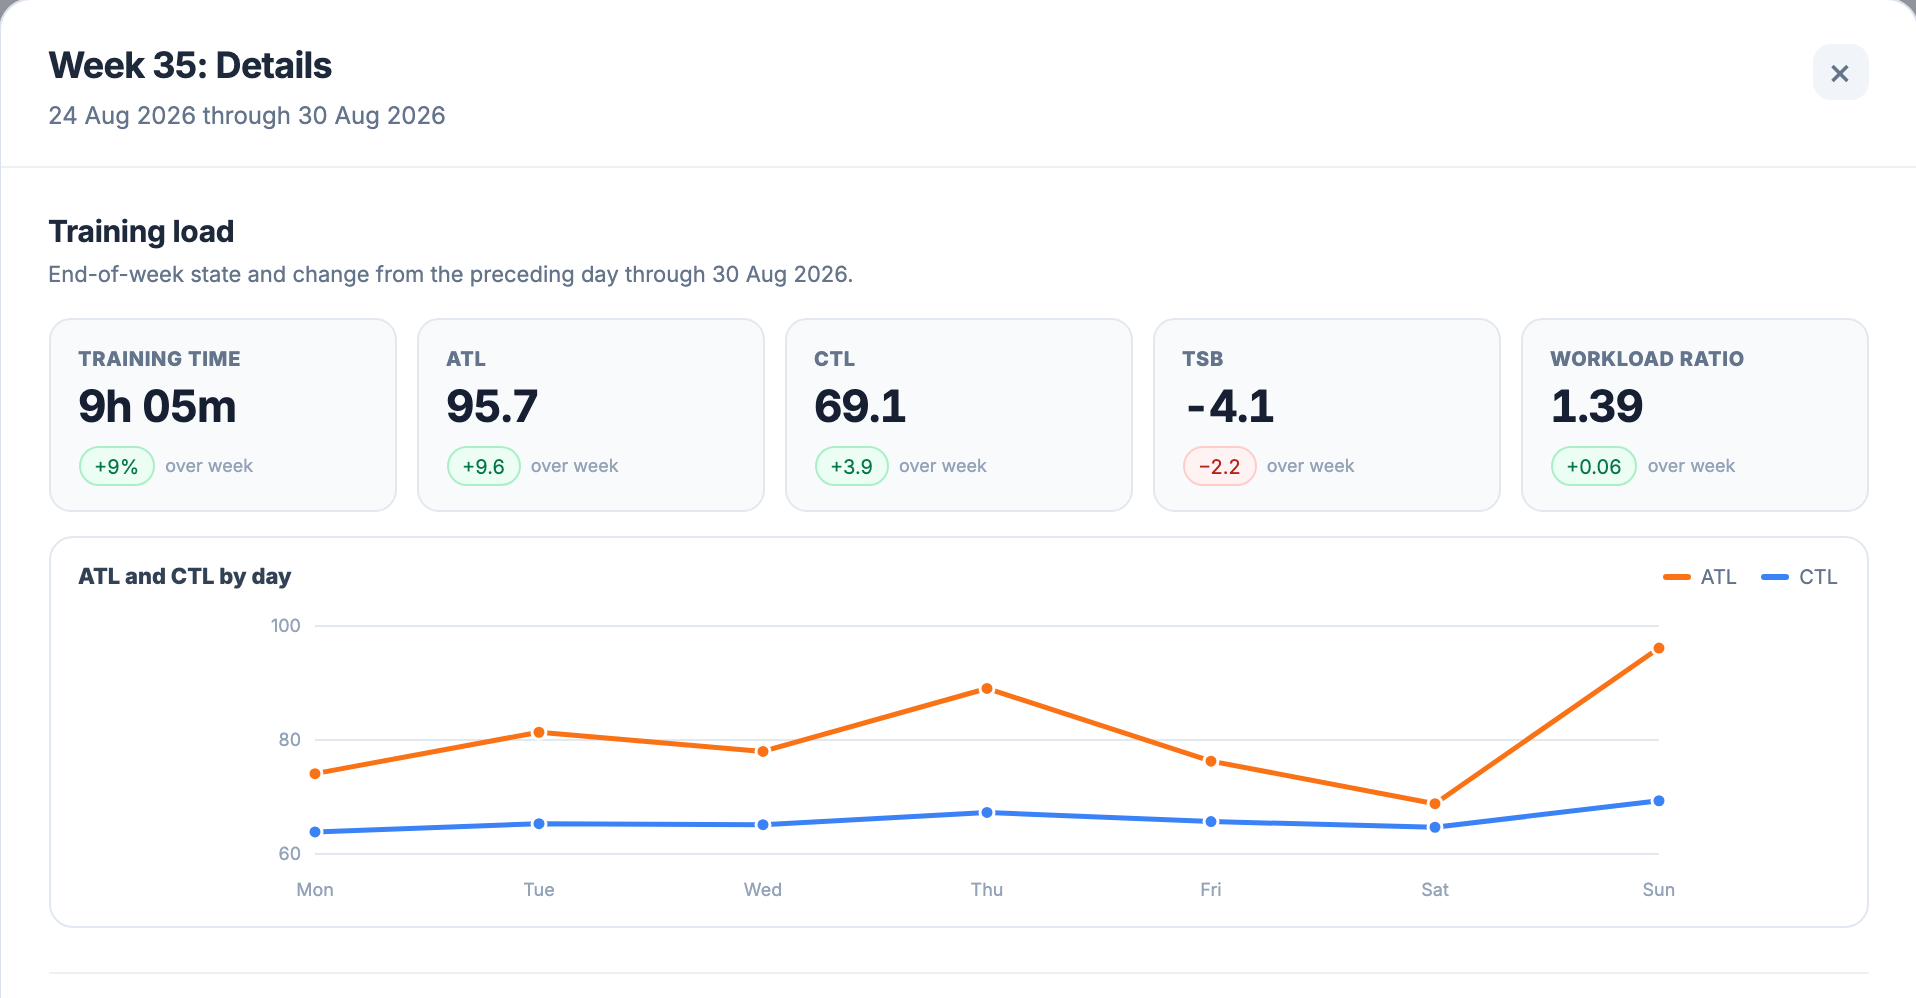
For a completed week, changes compare the final day with the day before the week began. A week in progress stops at the available endpoint, so it is not a full-week comparison. Planned workouts retain their estimated load separately; they do not enter completed CTL and ATL before a recorded activity exists.
For the change in CTL over a rolling week, see Ramp Rate. For elapsed duration, sport filters and weekly or monthly totals, use Training Volume.
Check what the history actually contains
The calculation starts at zero at the beginning of available activity history. The first 41 days carry low-confidence context. An empty stretch before imported history begins is unknown, not a series of rest days. Zooming out cannot recover workouts that were never imported.
Within the recorded history, a real rest day contributes zero and the averages decay. An imported activity without calculable TRIMP makes that day incomplete; usable TRIMP from other sessions still counts. A workout never imported can look like no recorded activity. Check missing recordings and HR coverage before explaining a sudden drop as recovery.
Your account timezone determines the local start day. An activity crossing midnight belongs to its start day. Importing older training or correcting applicable HR settings can change later values after recalculation. The graph describes the history currently recorded in your account, including those corrections.
CTL, ATL and TSB describe recorded load. They do not directly measure fitness, tiredness or readiness to race. Compare the training pattern with Health Metrics & Readiness and how you feel. The Training Load methodology documents the full calculation; Swimming Analytics shows how swimming contributes.
All Pro features are free through January 31, 2027. No credit card or automatic charges. After Early Access, keep using Free or choose Pro. See Free and Pro plans.