# Health Metrics & Readiness
Canonical HTML: https://effortsignal.com/features/recovery-readiness/
Last content update: 2026-09-16
Open Readiness on Dashboard to see how your HRV, resting heart rate, sleep and recent workload contributed to the day's score. A dedicated Readiness page shows daily graphs with their baselines and the selected day’s measurements alongside them. Choose a preset period or custom dates to inspect the history. Inside a completed workout, Heart rate provides a separate view of recorded R-R intervals and beat-to-beat variability.
The screenshots use synthetic health history and a synthetic ride near Lac d’Annecy, rendered by EffortSignal's web app. Readiness, its factor details and the activity sensor charts are included in Free and Pro. The calculations below describe the current product rules.
Start with the Readiness card on Dashboard
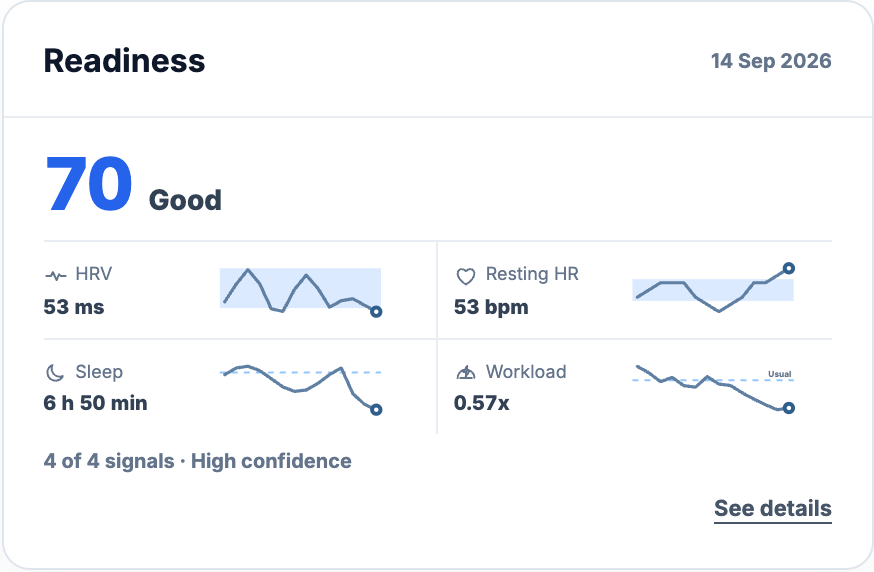
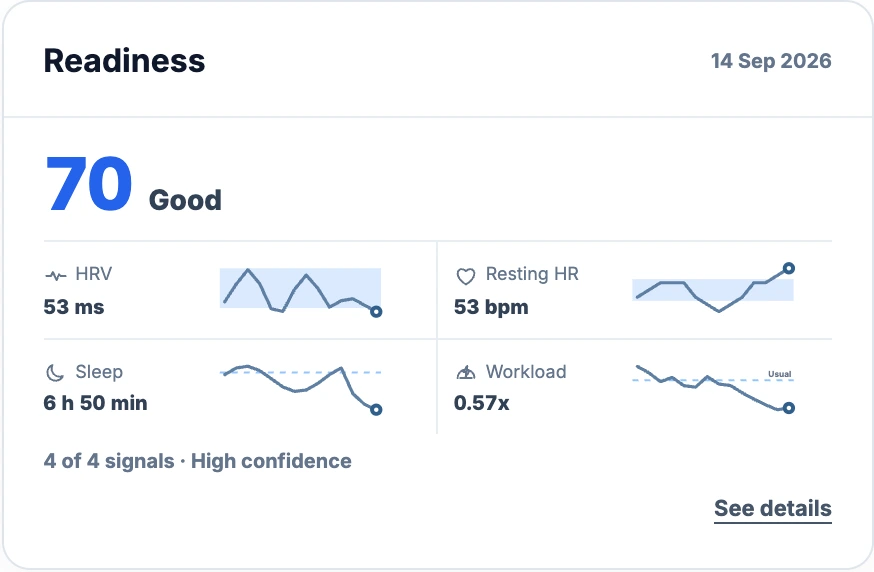
The card shows a dated score, its label and four small graphs. **HRV** and **Resting HR** have shaded personal reference bands. **Sleep** has a target line. **Workload** has a reference line at an ATL/CTL ratio of 1.0. Beneath the graphs, the card reports how many of the four signals contributed and the confidence in that result.
[](/marketing/product/catalog-health-dashboard-desktop.png)
This demo has enough compatible history for all four components. Its lower HRV and higher resting HR are visible before opening the details.Enlarge the Readiness card
Use **See details** at the bottom right of the card to open the **Readiness** page. The rest of the card stays available for text selection and graph tooltips. The value is not a fresh measurement taken by EffortSignal. It is a calculation from the daily health data and completed workload already available for that date.
The score and its confidence answer different questions. Here, **70 · Good** describes the combined component scores. **High confidence** means the inputs and their histories meet the model's coverage and quality requirements. A low score can also have high confidence.
Read each measurement beside its graph
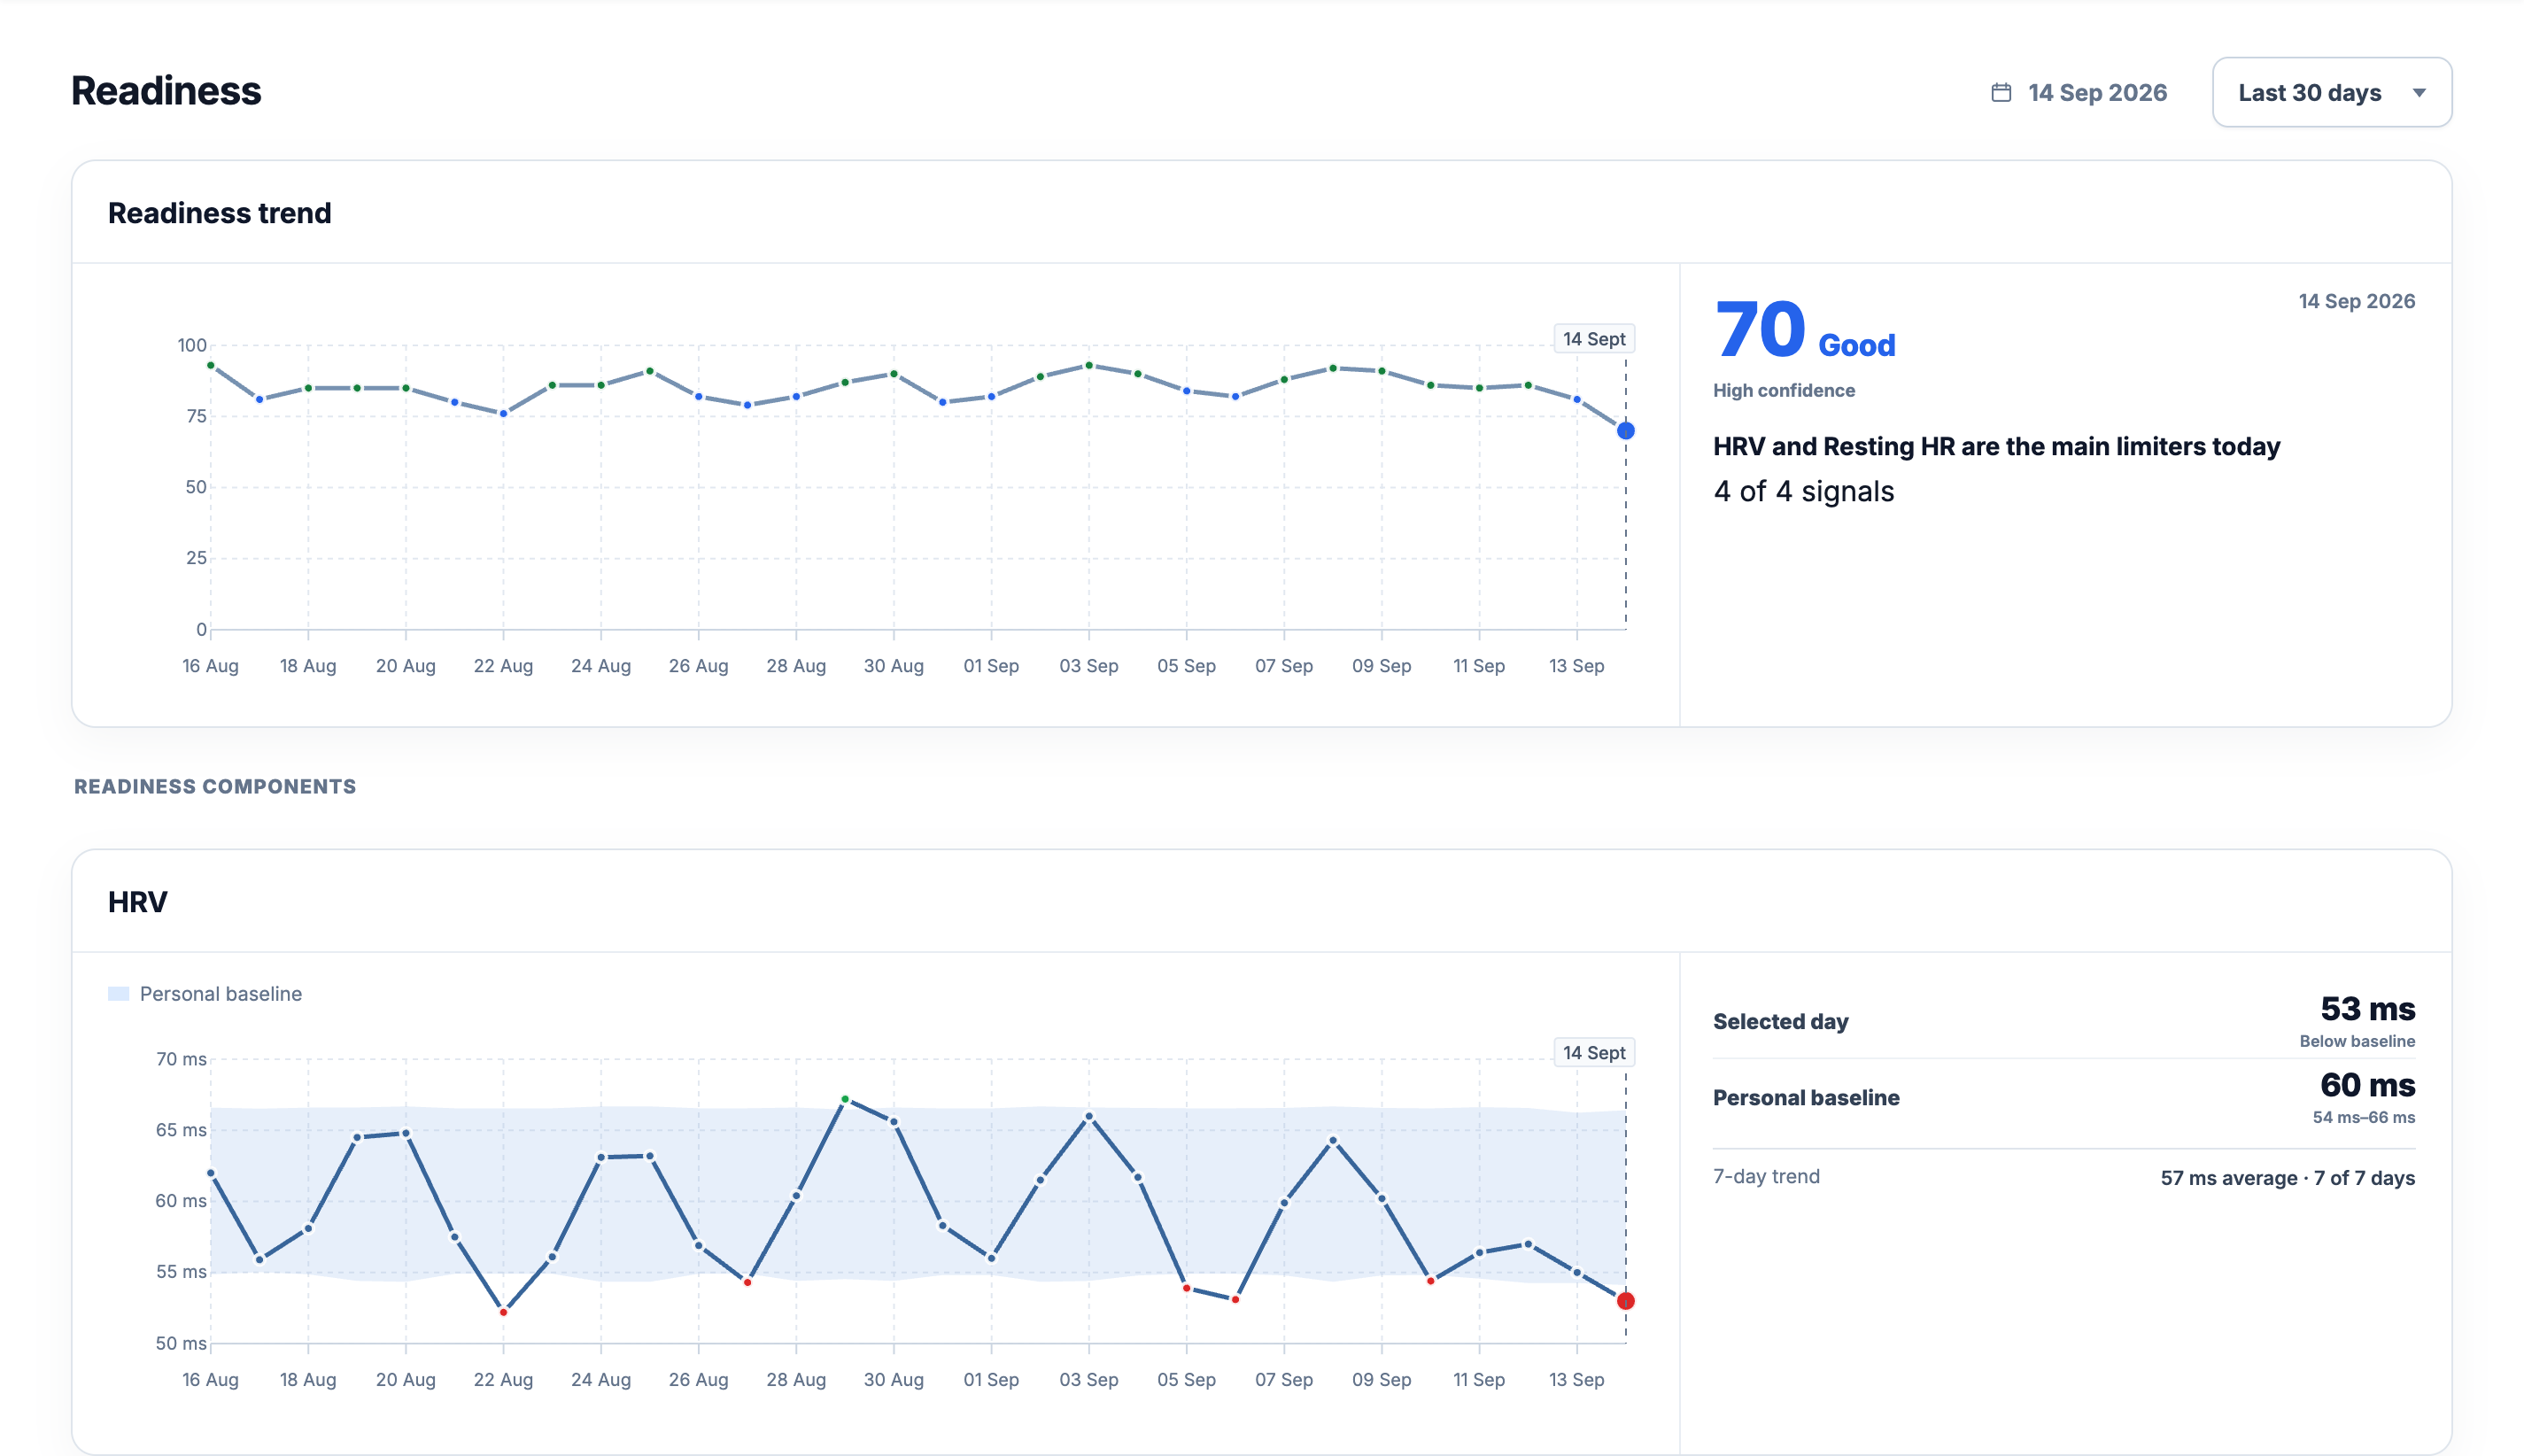
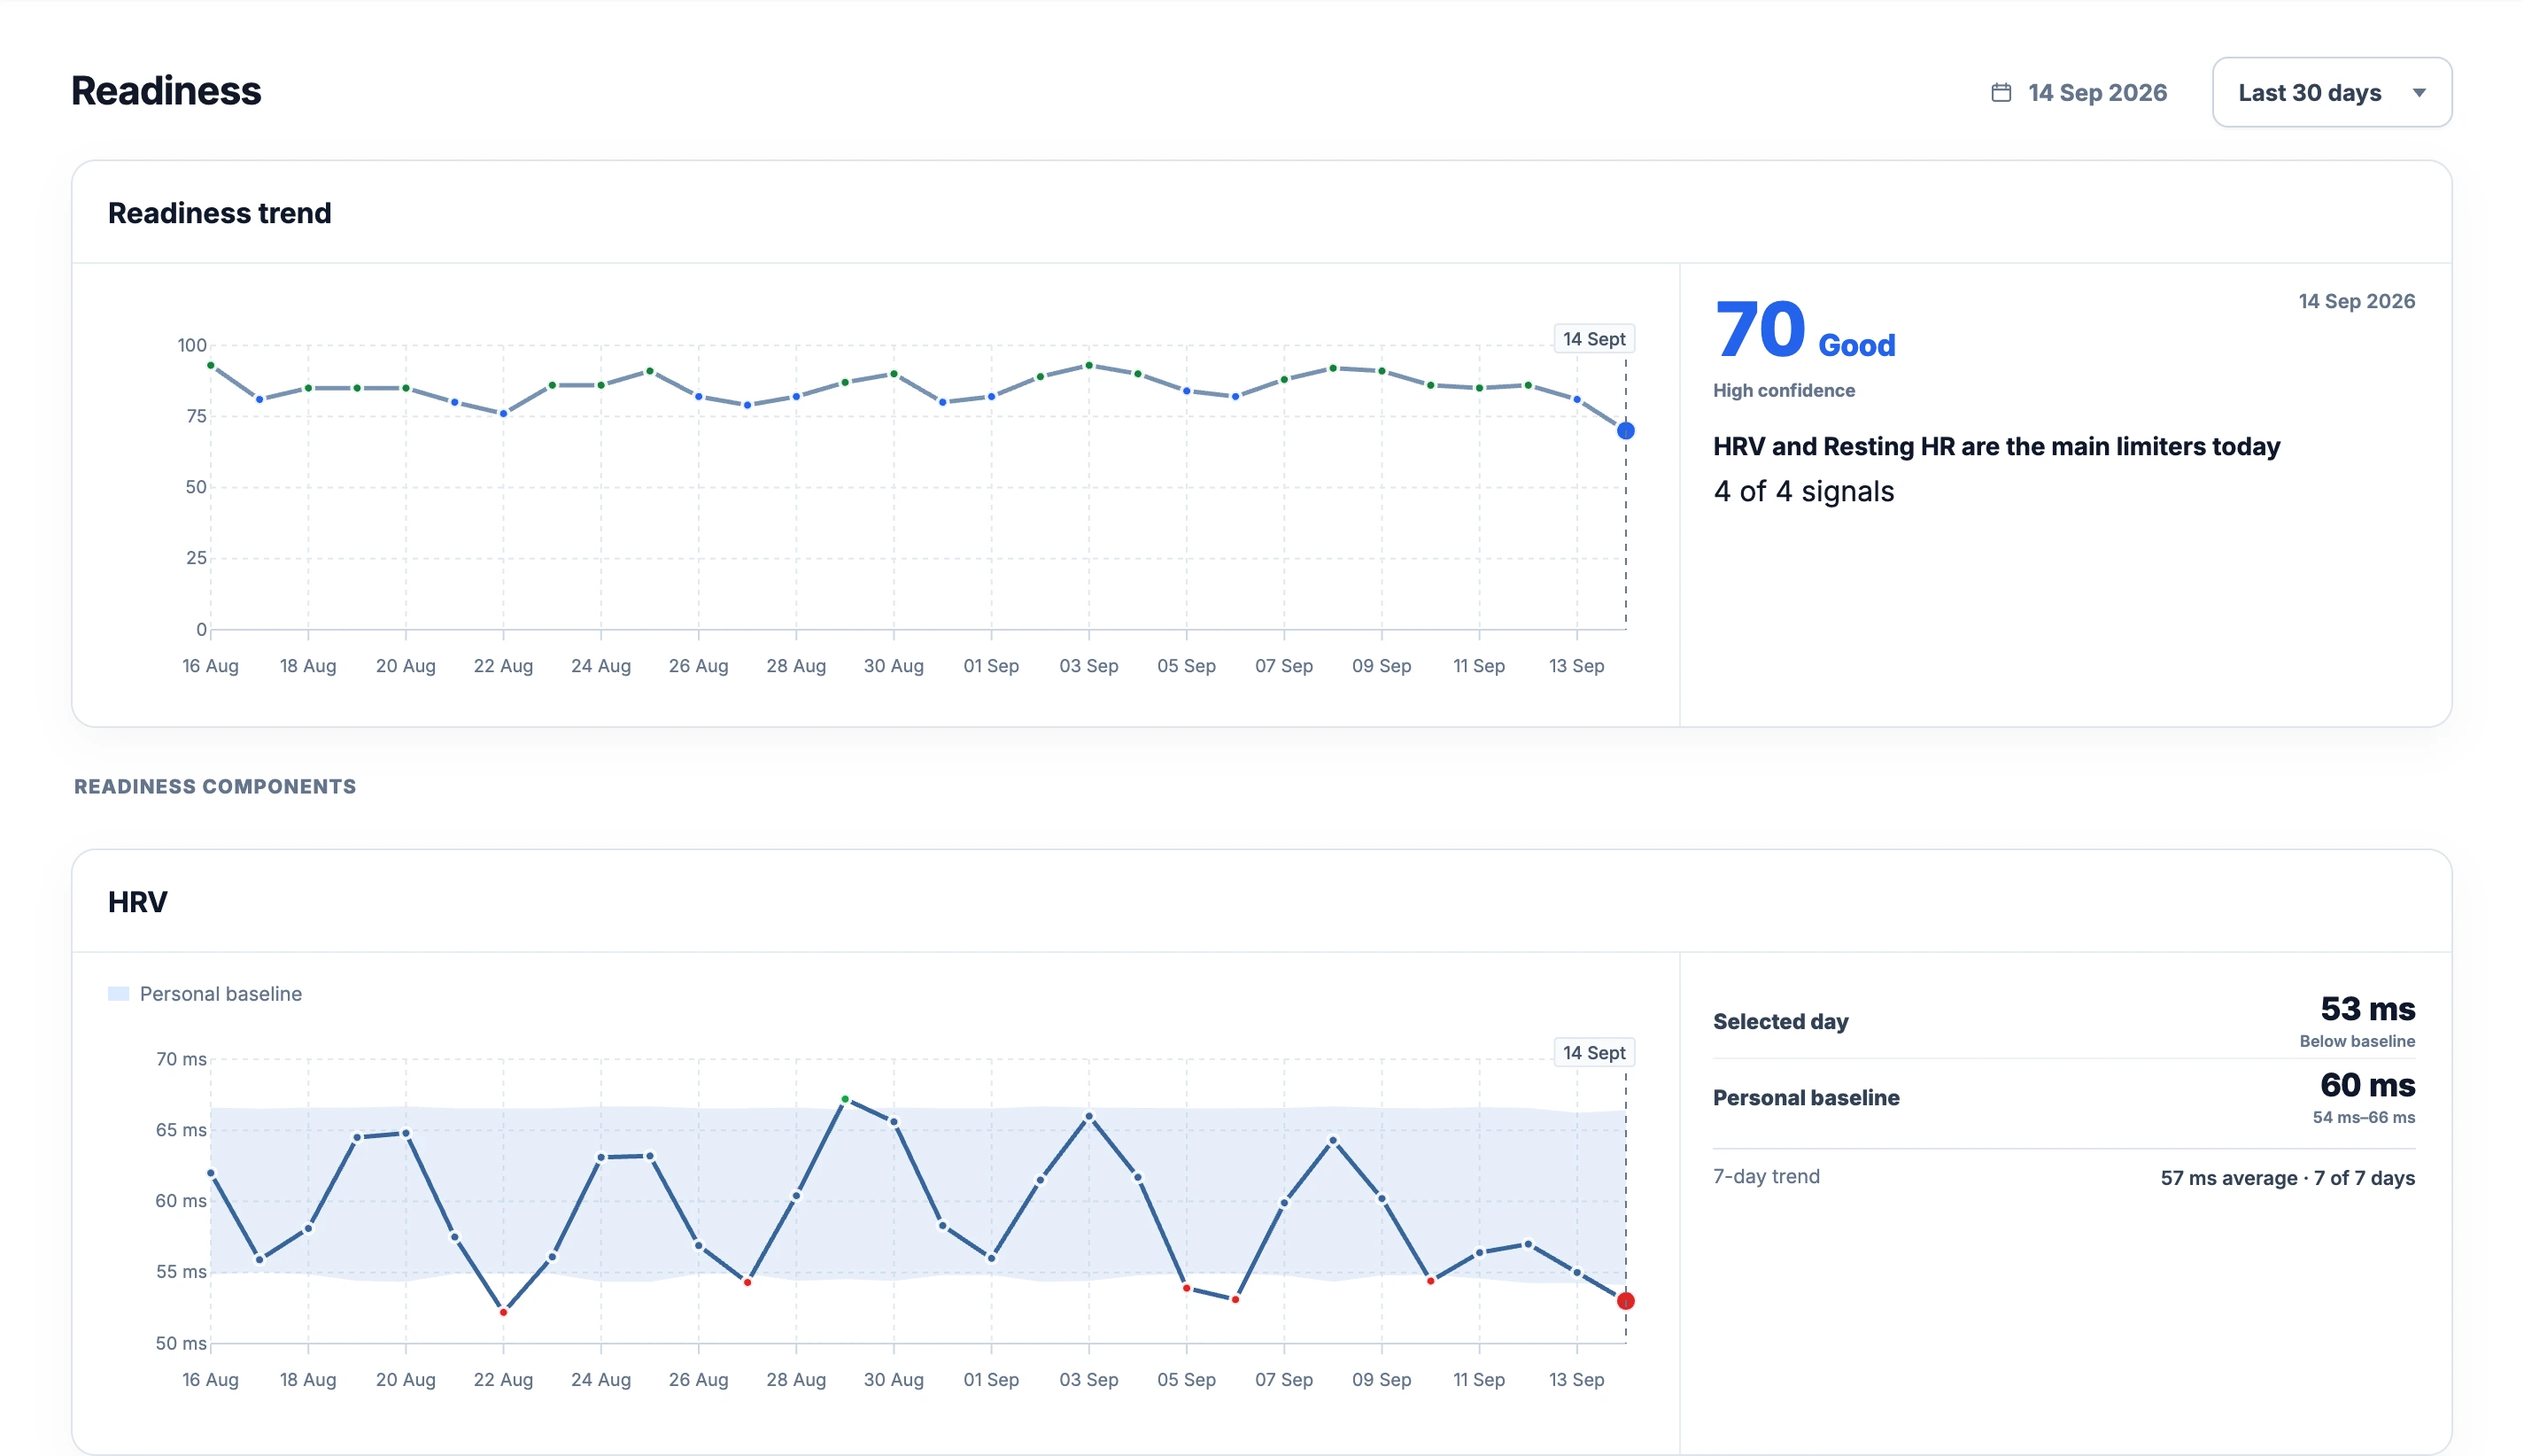
The page starts with **Readiness trend**. The **Readiness components** heading separates it from **HRV, Resting HR, Sleep and Workload ratio**. On desktop, each graph has a column of details aligned to the top on the right. The selected reading and its baseline or target are larger, with the comparison status directly under the reading. Recent trends and coverage sit below a divider. These details are always visible. On phones they move below the graph.
The score summary shows the selected day's date in its upper-right corner, together with the score, confidence, main limiters and signal coverage. A day selector and the narrow period selector stay at the top of the page. The calendar selects the same day as the graphs.
[](/marketing/product/catalog-health-details-desktop.png)
The status labels describe comparisons with this athlete's references. A lower HRV reading does not mean the same thing for every athlete.Enlarge the factor overview
For HRV and resting HR, the side column includes **Selected day, Personal baseline and 7-day trend**. Sleep uses a sleep target; workload shows **Acute load (ATL)** and **Chronic load (CTL)**. Expand **Methodology and data sources**, below all five charts, to read the calculations and **Latest measurement date, Data source, Device, Measurement method, Component score and Weight**, plus the sleep target source. This section starts collapsed; its chevron follows the same interaction as Breakdown. These details update when you select another day.
The main-limiters sentence is calculated from the component scores. EffortSignal checks how much the aggregate would change if each component were replaced with the neutral reference score of **90**, leaving the others unchanged. It names at most two factors with a material downward effect. These are explanations of the model, not identified causes of fatigue or illness. Their effects are not additive deductions from 100.
Select a date and inspect the whole day
The page opens with **Last 30 days**, ending on the date opened from Dashboard. Choose another preset in the period selector or **Other…** to set an inclusive start and end date in the calendar. Custom history can cover up to two years and cannot end in the future. Cancel keeps the current period. The page URL retains the period and selected day, so a bookmark, reload or browser Back/Forward returns to the same view.
Select a day anywhere in **any of the five graphs** to update the score, all four metric columns and source details together. Left and Right arrow keys move through every calendar day, including days without a score or stored result. The same vertical date guide appears across the graphs, with a larger point where a value exists. Every Readiness point uses its day's label color, while the vertical scale runs from **0 to 100**. A grid and matching day marks make dates easier to compare. Missing results remain gaps; a single result remains one point.
Changing the period keeps your selected day. If that day falls outside the visible period, the summary says so and continues to show its evidence. Seven-day summaries always end on the selected day, even when some of those dates are outside the graph. Browser Back restores both previous day selections and period changes. A day without an overall score still exposes its available components; a day without a stored result shows missing data for that exact date. When HRV or resting HR retains an earlier measurement for trend-based scoring, its actual date stays visible and it is not counted as a new measurement on the selected day.
Each metric graph uses the reference saved for its own date. HRV and resting HR show personal baseline bands; sleep shows its target line. Hover a point for the exact date and value. Points outside references are colored: lower HRV or sleep is red and higher is green; resting HR uses the opposite direction. Workload is amber below its optimal band and red above it. These are visual comparisons, not a new Readiness calculation.
**Calendar → Week details** also includes a Readiness chart for that week's seven dates, after Training Load. Missing and future days remain empty, and workout filters do not change the daily Readiness scores.
Use the date beside the score and **Latest measurement date** in the methodology section together. They can differ. When today's physiological measurement is missing, a sufficiently populated recent trend may still contribute, with a quality note. On the live Dashboard, the most recent stored result within the 14-day history may be displayed if today has no result. Its actual date remains visible. An explicitly selected historical date stays anchored to that day.
Opening a historical point reads the stored calculation; it does not rerun an old night against today's baseline. This matters after switching devices or accumulating more history. Use the Dashboard navigation link or browser Back to return to Dashboard.
Nightly HRV: compare like-for-like measurements
**Heart rate variability (HRV)** describes variation in the intervals between beats. A resting heart rate of 50 bpm says little about how those intervals varied. For Readiness, EffortSignal prefers an available positive **RMSSD** value and supports **SDNN** when RMSSD is unavailable. These are different HRV statistics, so an RMSSD baseline is never filled with SDNN measurements.
Nightly HRV arrives as a daily measurement from the source. EffortSignal does not reconstruct an entire night's beat recording from that one number. Supported manually entered measurements can also contribute, but their source and measurement method remain part of their identity.
[](/marketing/product/catalog-health-hrv-desktop.png)
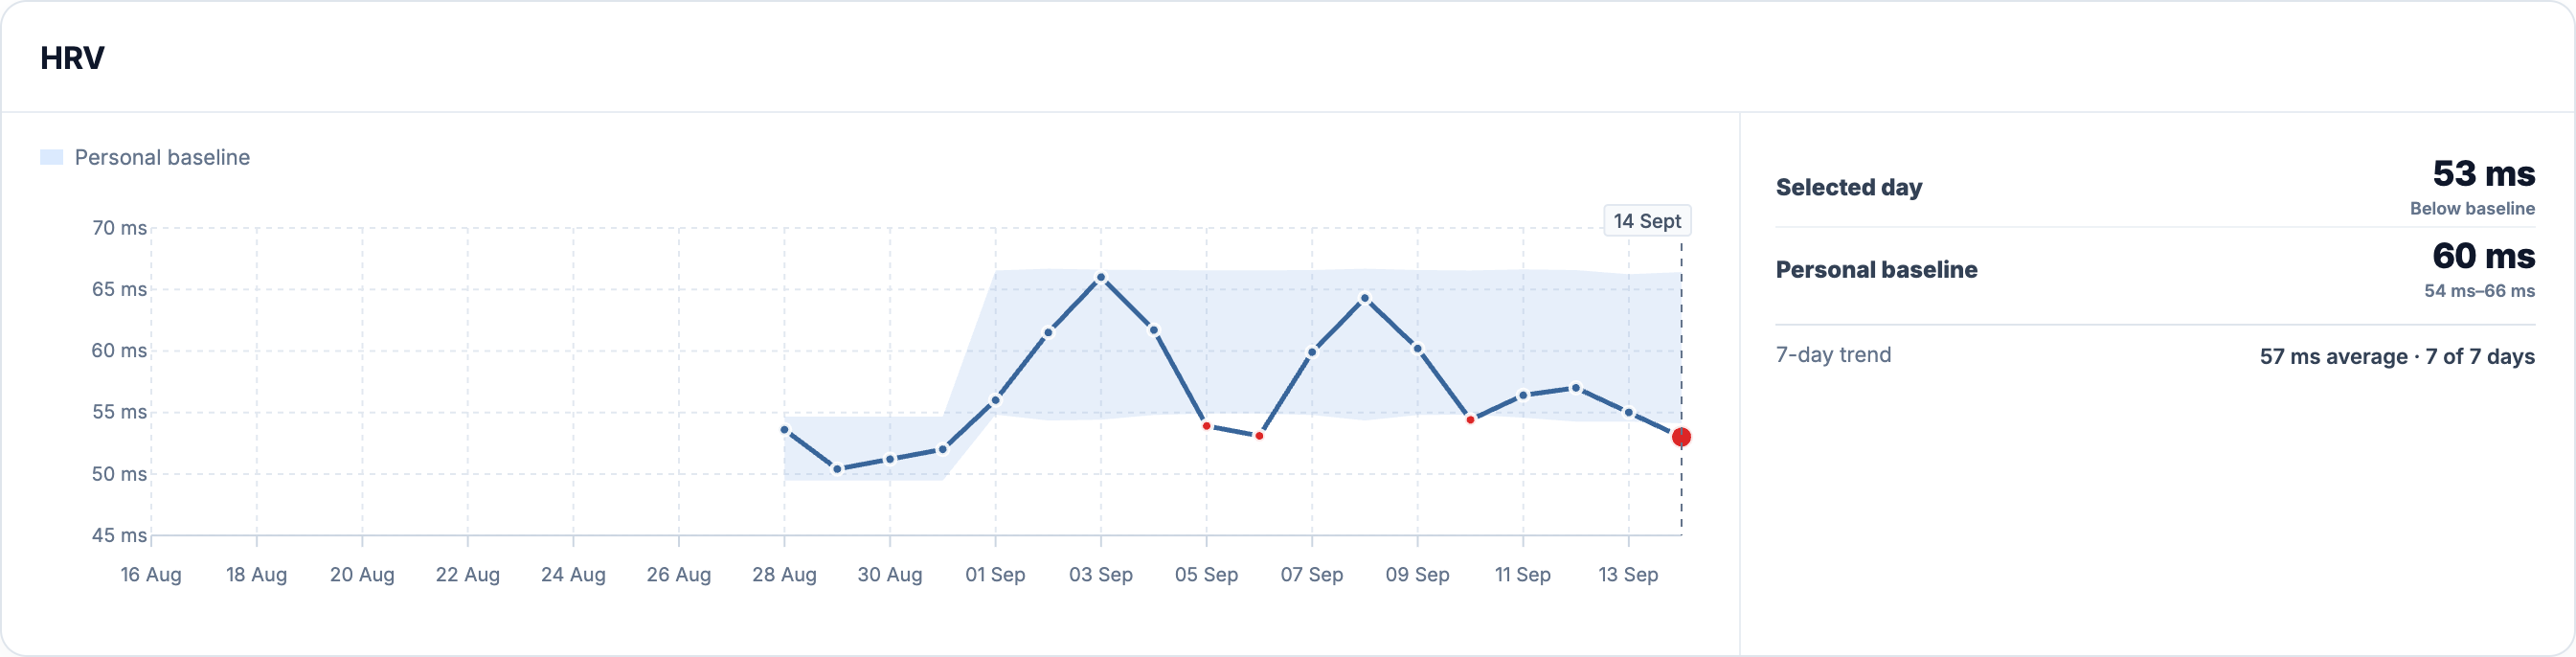
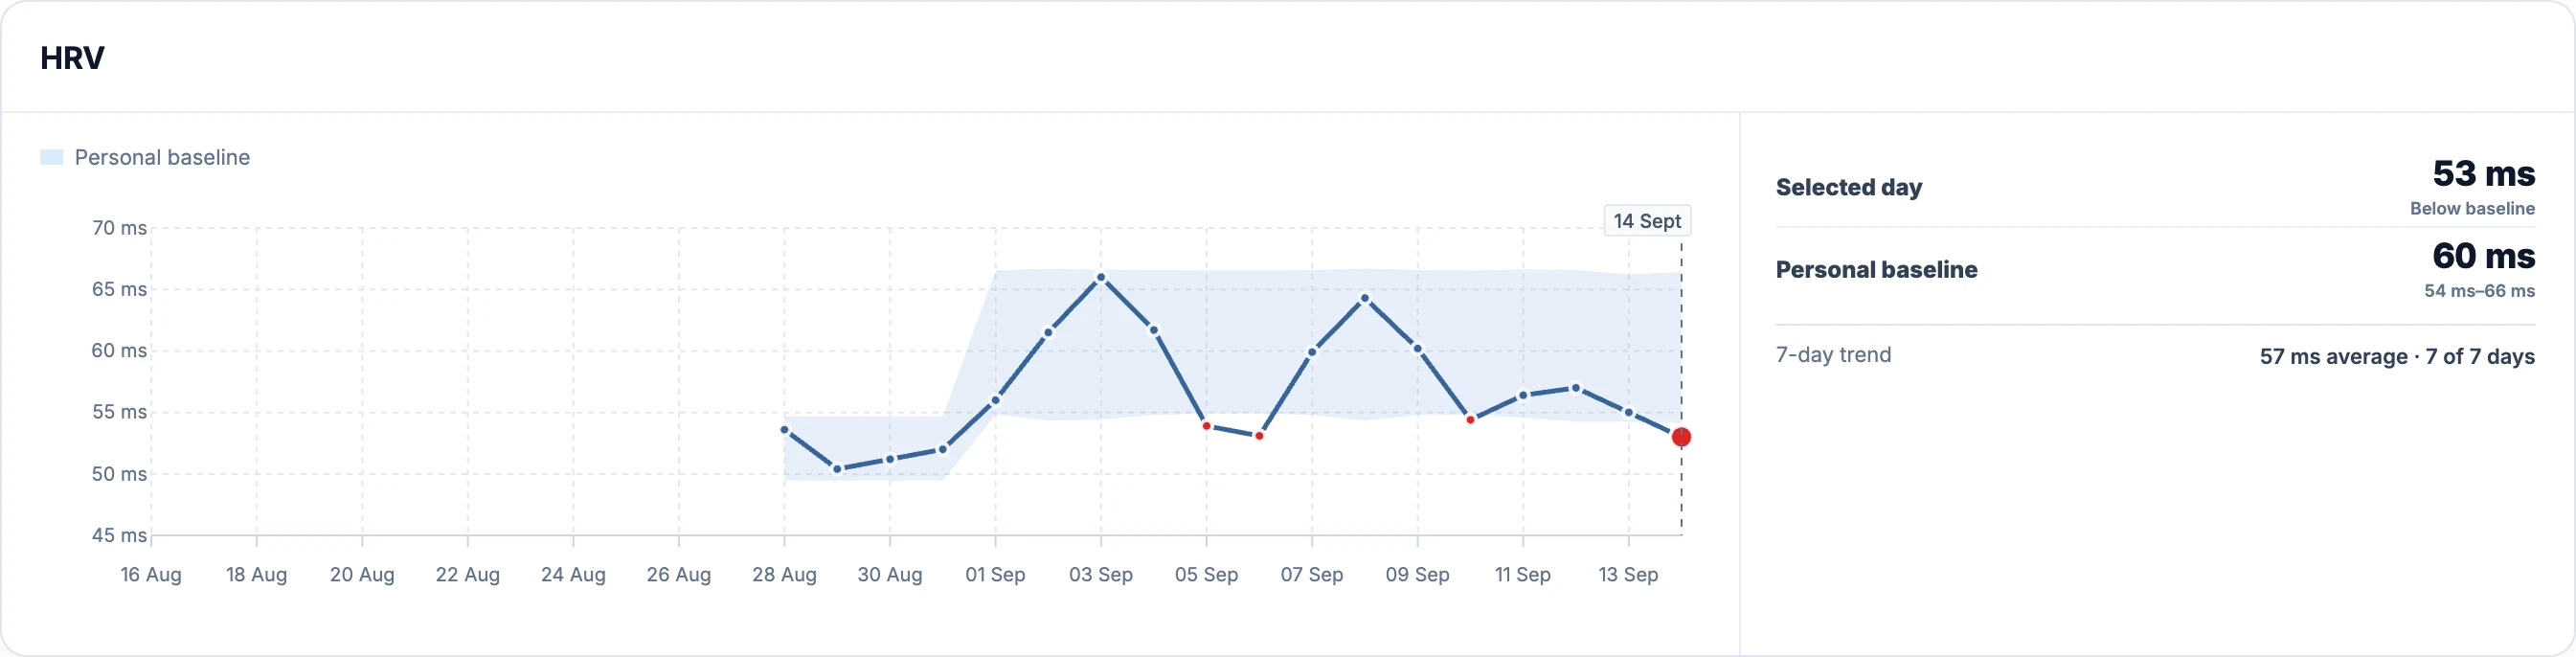
The demo's 53 ms is compared with its own history: a centre of approximately 60 ms and a displayed band of 54–66 ms. The component score is 67, with a configured weight of 35%.Enlarge the HRV details
HRV comparisons depend on how and when the measurement was made. Recording conditions, posture, breathing and artefacts can affect the result. [Laborde, Mosley and Thayer's measurement recommendations](https://www.frontiersin.org/journals/psychology/articles/10.3389/fpsyg.2017.00213/full) explain those methodological concerns. EffortSignal uses that need for comparability as a product constraint: recorded changes of provider account, device or measurement method define a different physiological baseline. If the source does not identify a device, the detail reads **Not reported**. EffortSignal cannot distinguish an unreported device change from the same source.
A single unusually high HRV value is not rewarded without limit. The HRV score has an upper endpoint, and a reading far above its reference can carry a quality flag. Read the recent trace and source details before interpreting an isolated point.
Resting heart rate: the same baseline, in bpm
**Resting HR** uses the recorded daily resting heart rate, rather than average heart rate from a ride. Its personal baseline follows the same history and compatibility rules as HRV, but calculations stay in **beats per minute**. The scoring direction is reversed: a higher deviation lowers the component score; a modestly lower deviation can raise it.
[](/marketing/product/catalog-health-rhr-desktop.png)
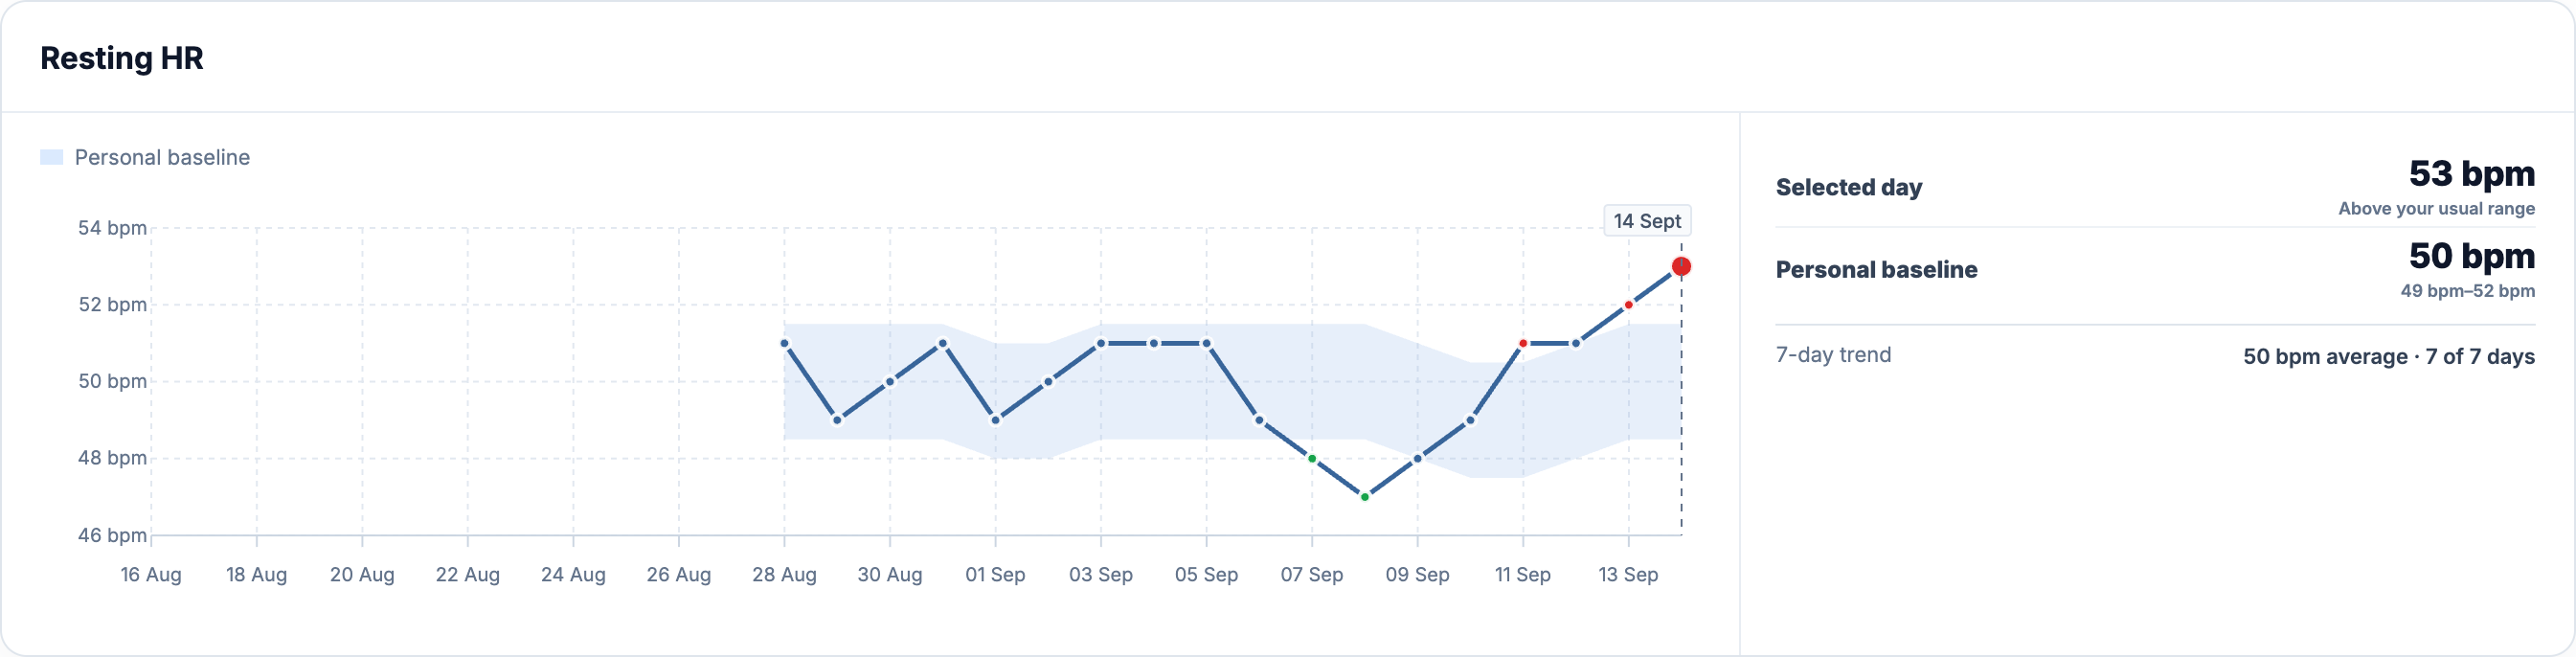
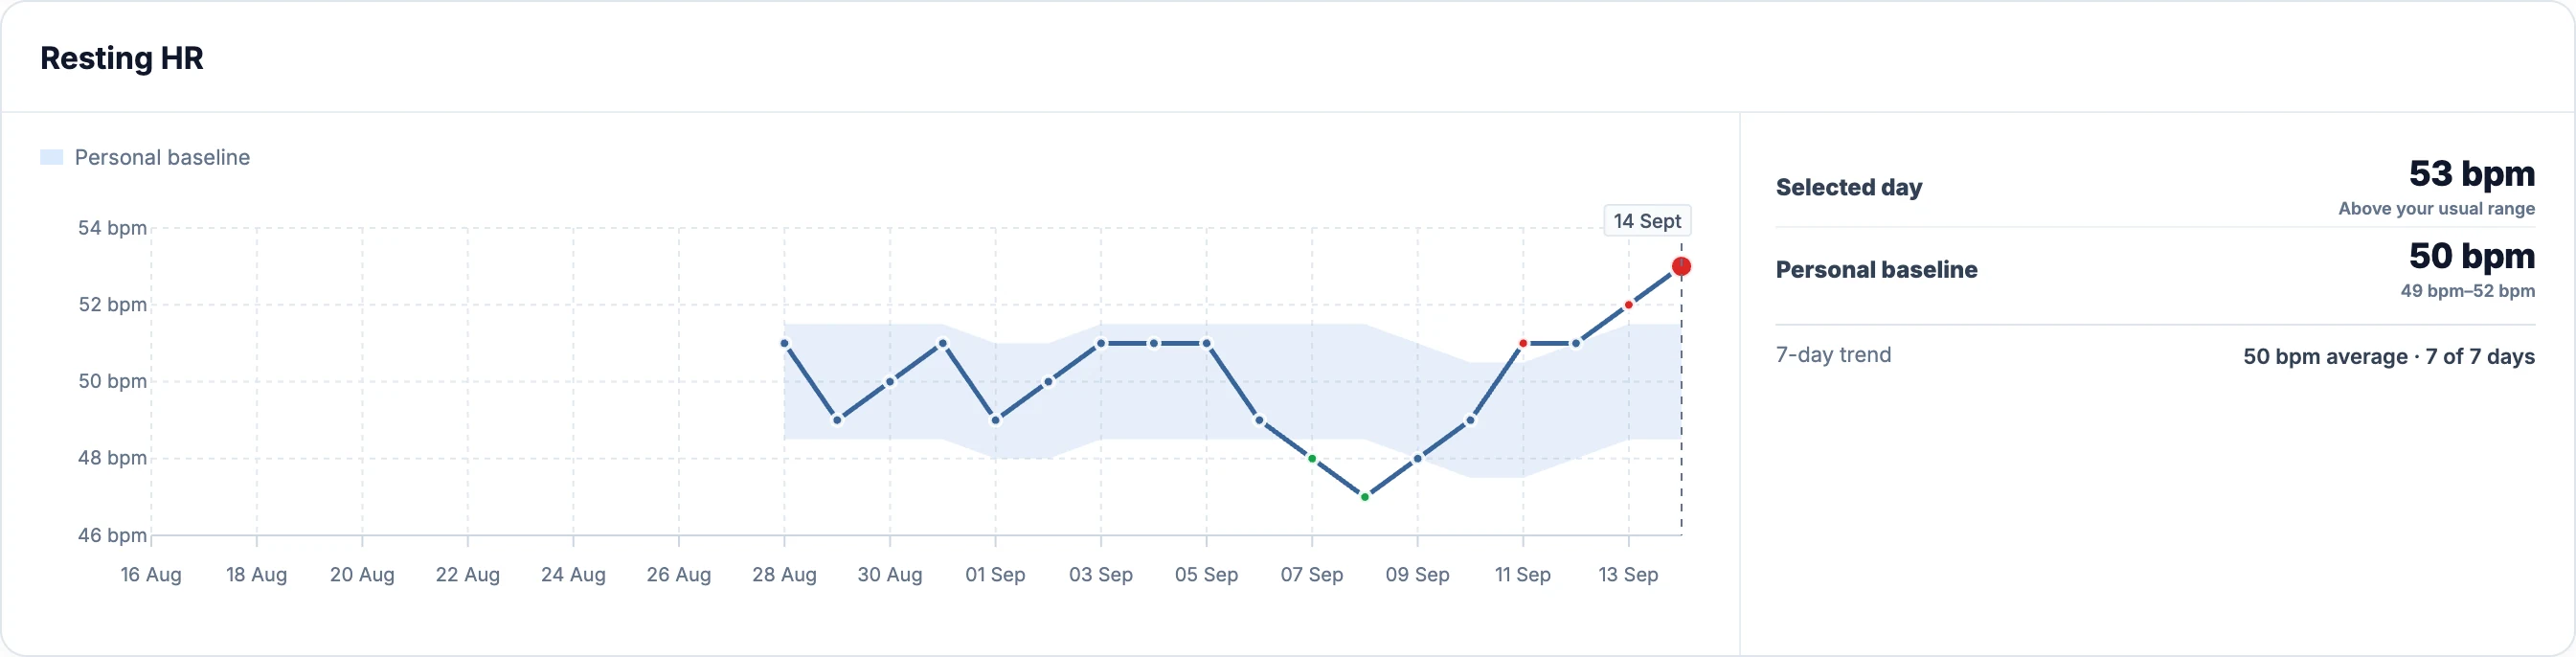
Here, 53 bpm is above a centre of 50 bpm. The reference band is 48.5–51.5 bpm before display rounding; the component carries 15% of the configured weight.Enlarge the resting-HR details
The number is evaluated against this athlete's recent measurements. The interface does not use a universal “good resting HR” cutoff. Check the graph for a sustained change, then check the source, device and measurement date. A change in the recording setup needs a different interpretation from several comparable readings moving together.
How the personal baseline and shaded band are calculated
For each physiological factor, the calculation looks back over the **preceding 42 local days**, excluding the date being scored. It takes at most one compatible observation per day. Compatibility includes the metric, provider, connected account, device and measurement method. Missing days do not become zero readings.
| Compatible observations in that window | What the model can use |
| --- | --- |
| Fewer than 14 | Baseline still forming; that physiological component cannot be scored |
| 14–27 | Enough observations to score the component, with a forming baseline |
| 28–41 | Reliable baseline |
| 42 | Mature baseline with the full daily window |
HRV is first transformed using a natural logarithm; resting HR remains in bpm. The centre is the **median**. The spread uses the **median absolute deviation (MAD)**: the median distance of the observations from that centre. These choices reduce the influence of one extreme observation compared with a mean and ordinary standard deviation.
```text
centre = median(history)
MAD = median(abs(each history value − centre))
scale = max(1.4826 × MAD, minimum scale)
today's deviation = (today's value − centre) / scale
```
The minimum scale is **0.05 for log HRV** and **1.5 bpm for resting HR**. It prevents an almost flat baseline from turning a very small change into an enormous standardized deviation.
The shaded band is the centre plus or minus one scale unit. For HRV, those boundaries are transformed back into milliseconds. It is a personal reference band, not a population norm, a medical confidence interval or a safe-training zone. The textual comparison uses its own deviation thresholds, so it is not simply a label for whether a point falls inside the shaded band.
Today's value and the recent trend both contribute
The physiological trend window contains the selected day and its six preceding days. With at least **three compatible observations**, its transformed median is compared with the same baseline. When today's value and the trend are available:
```text
scoring deviation = 0.70 × today's deviation + 0.30 × trend deviation
```
If only today is usable, the model can use it with an incomplete-trend flag. If today is missing but enough compatible observations remain in the recent window, it can use the trend alone with a quality flag and retain the latest measurement date. It does not pretend that the missing night was measured.
There is a distinction inside the interface: the **7-day trend** field is an **arithmetic average of the available raw values in the stored daily results**, with a count such as “7 of 7 days.” The score uses the median-based calculation above. The displayed average helps read recent history; it is not the exact intermediate value used by the algorithm. For older selected dates near the beginning of the displayed history, fewer stored values may be available to that UI summary.
How a deviation becomes a component score
Scores interpolate linearly between these points and stop at the endpoints. A zero deviation maps to **90**, rather than 100. In the table, z denotes the combined standardized deviation described above.
| HRV z | HRV score | Resting-HR z | Resting-HR score |
| --- | --- | --- | --- |
| −2.5 | 10 | −0.5 | 95 |
| −2.0 | 28 | 0 | 90 |
| −1.5 | 48 | +0.5 | 82 |
| −1.0 | 68 | +1.0 | 68 |
| −0.5 | 82 | +1.5 | 48 |
| 0 | 90 | +2.0 | 28 |
| +0.5 | 95 | +2.5 | 10 |
These mapping points are EffortSignal's scoring policy. They should not be read as validated medical boundaries or attributed to a general HRV research paper.
Sleep: total duration, target and recent nights
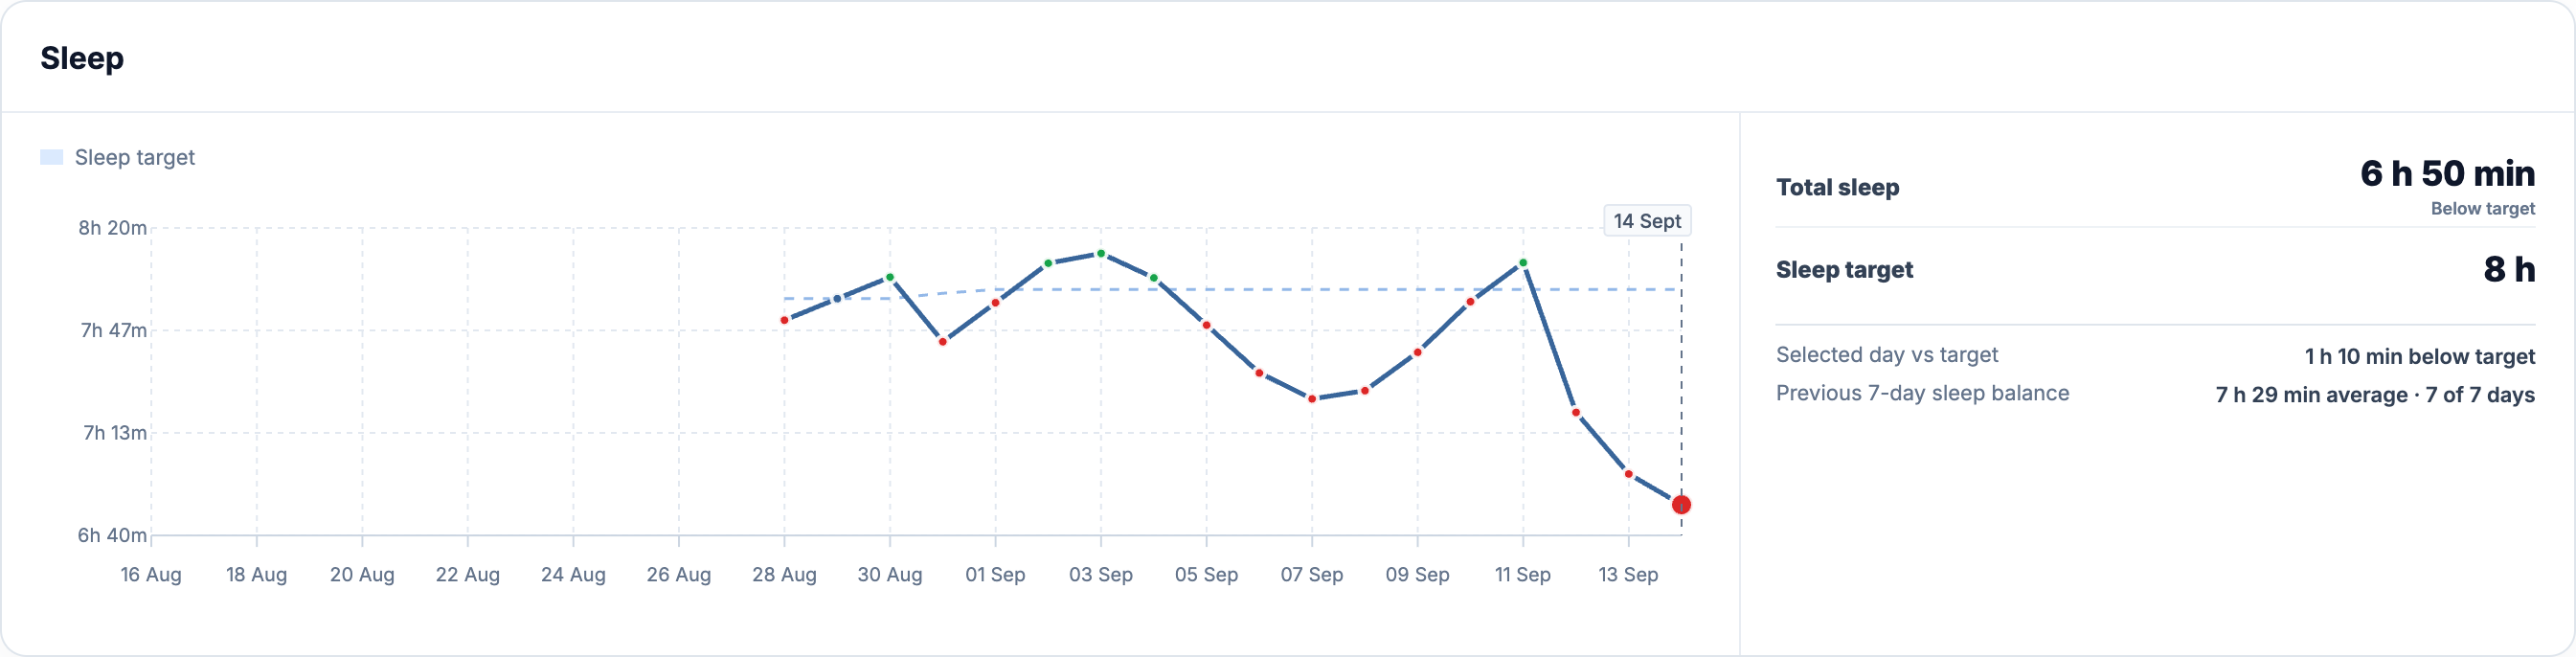
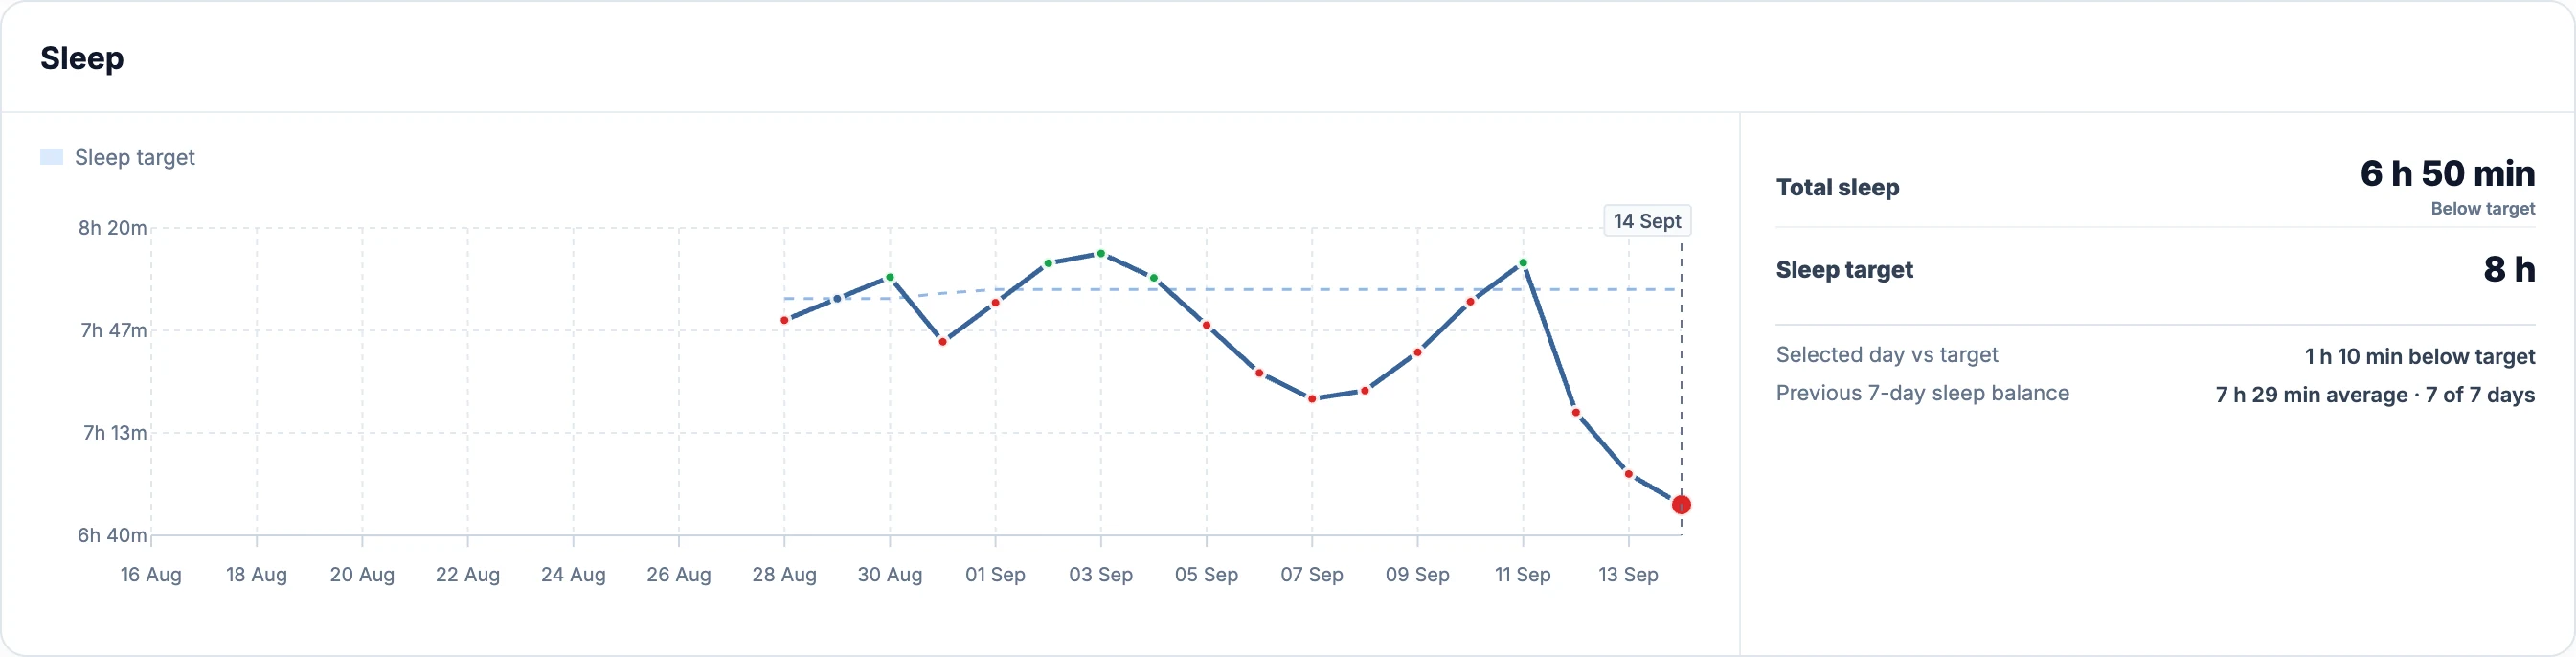
The **Sleep** column shows **Total sleep, Sleep target, Selected day vs target and Previous 7-day sleep balance**. Target source, component score and weight are in the methodology section below the charts. The dashed line in its graph marks the target duration. This chart uses time, not the wearable's proprietary sleep score.
[](/marketing/product/catalog-health-sleep-desktop.png)
The demo includes 6 h 30 min of main sleep and a separately confirmed 20-minute nap. Readiness uses their 6 h 50 min total.Enlarge the sleep details
Readiness adds a **confirmed nap duration** to the completed main sleep from the selected daily source. It does not infer a nap from inactivity or add another provider's sleep total on top. A missing completed main sleep makes the component unavailable, even if a nap is recorded.
The target follows this order:
1. Use a positive explicit personal target stored for the account when one is available.
2. Otherwise, with at least **28 recorded nights in the preceding 60 days**, use the **75th percentile** of their total sleep, bounded to **7–9 hours**.
3. Without enough history, use **8 hours** and disclose that default in the quality notes.
**Target source** tells you which reference was used. The detail panel displays that reference; it is not a sleep-target editor. Historical sleep is selected by the daily source-priority rules, rather than restricted to the exact device family used for HRV and RHR baselines. A recent source change is flagged. The history-based target reflects recorded sleep habits; it does not measure an individual's biological sleep requirement.
For scoring, today's total is divided by the target. The model also calculates a weighted ratio from the selected day and six preceding days. The weight halves every three days, and missing nights are omitted. It combines **70% of today's ratio with 30% of that recent weighted ratio**; today is also present in the recent window.
| Combined sleep-to-target ratio | Component score |
| --- | --- |
| 0.50 | 10 |
| 0.60 | 20 |
| 0.70 | 38 |
| 0.80 | 58 |
| 0.85 | 70 |
| 0.90 | 80 |
| 0.95 | 88 |
| 1.00 | 95 |
| 1.05 | 100 |
Values between these points are interpolated. Consistently sleeping exactly the target produces **95**, not 100. In the screenshot, the current shortfall and preceding nights together produce **75**. The **Previous 7-day sleep balance** is a plain average of available stored sleep totals, with a day count; it is not that weighted scoring ratio.
Sleep duration is one part of recovery. The [2021 athlete-sleep consensus](https://pubmed.ncbi.nlm.nih.gov/33144349/) discusses limitations in measuring sleep and translating short-term sleep restriction into performance predictions. EffortSignal's target bounds, percentile and score table are product rules, not a formula established by that consensus.
Workload: acute versus chronic heart-rate load
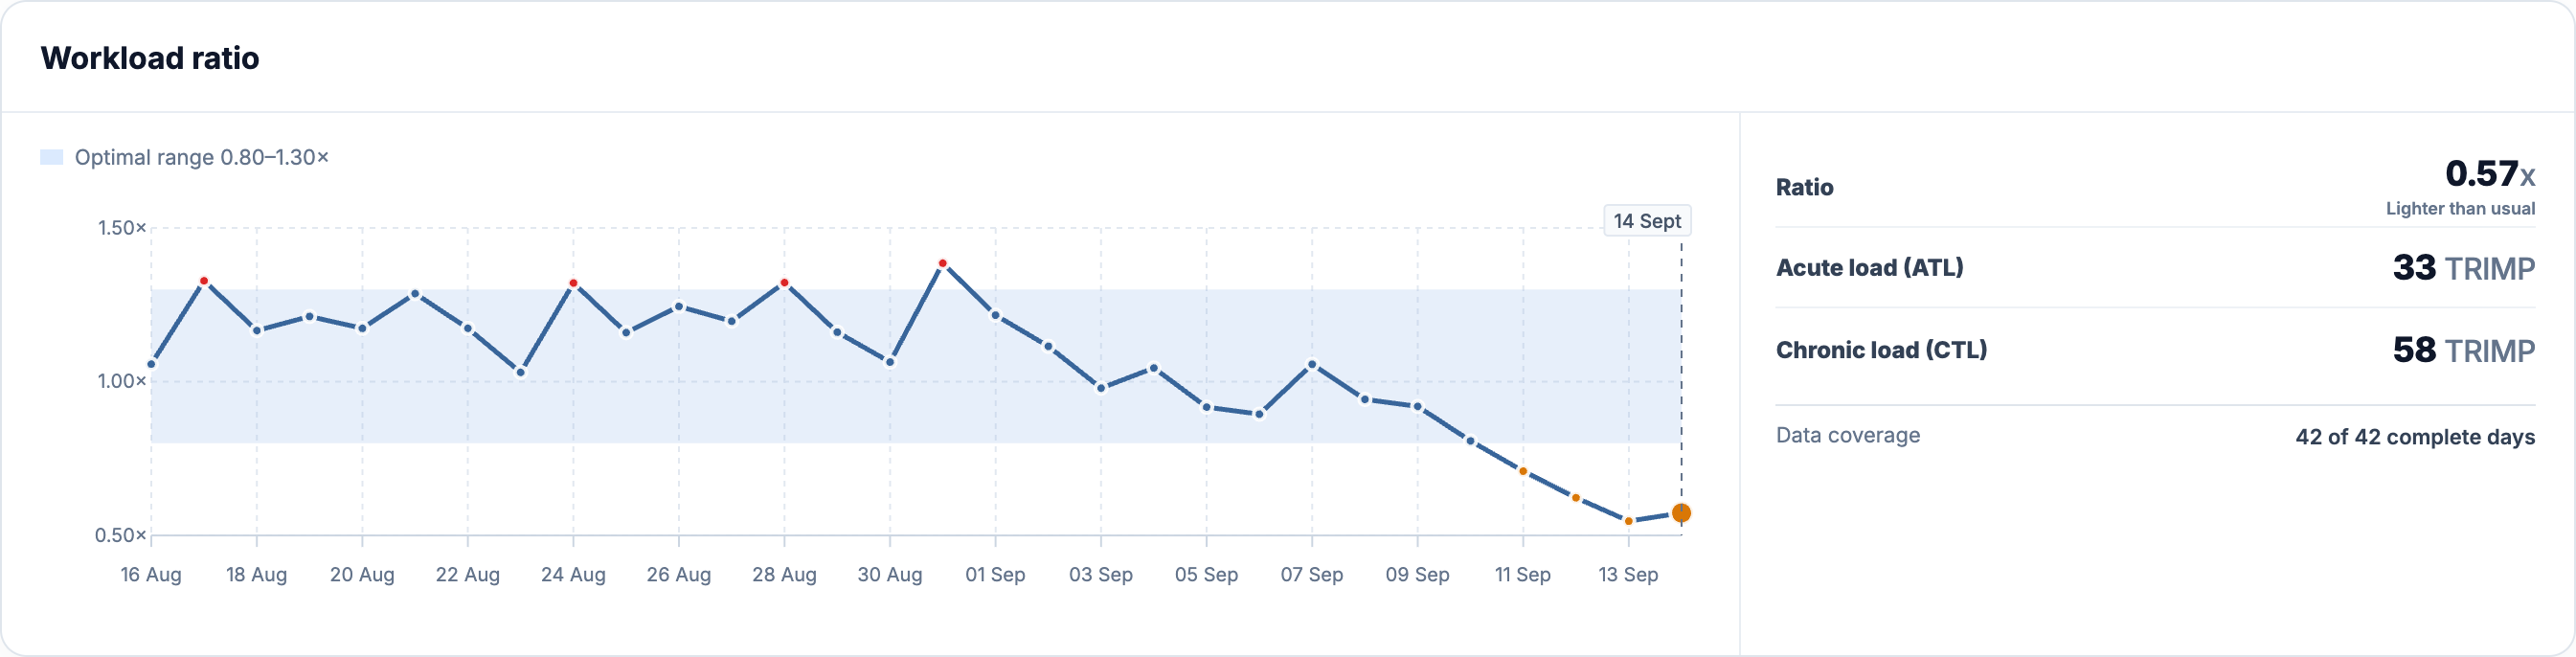
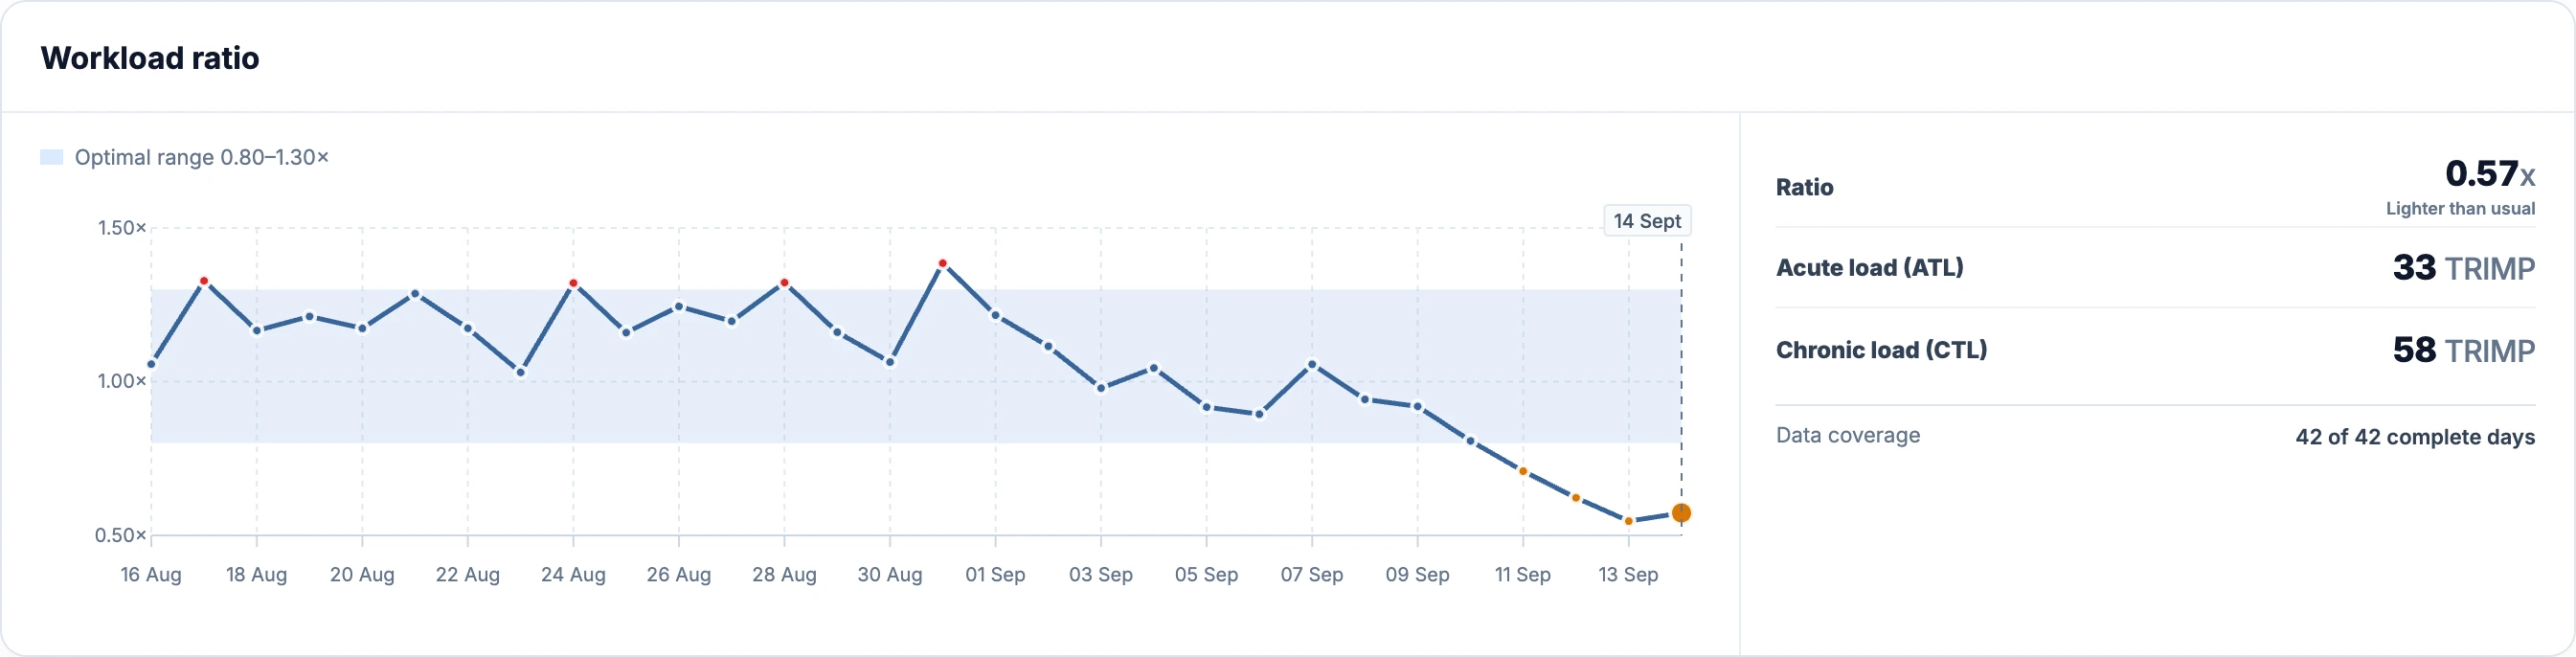
The **Workload ratio** column leads with the **Ratio**, **Acute load (ATL)** and **Chronic load (CTL)**, followed by data coverage. Both load values use **TRIMP**, the heart-rate-based load shared with Training Load. Component score, weight and data sources are in the methodology section. The graph shades an **optimal range of 0.80–1.30×**, using the existing training-load reference band. A ratio of **1.0×** means ATL equals CTL. The band is a visual reference; the component score follows the table below.
[](/marketing/product/catalog-health-workload-desktop.png)
The demo's acute load is below its chronic load. Its workload score of 100 means this component adds no downward pressure to Readiness; it does not grade the training plan as optimal.Enlarge the workload details
This comparison needs **42 complete dated load rows ending yesterday**. ATL and CTL are exponentially weighted daily TRIMP loads with **7-day and 42-day time constants**. They are smoothed daily values, not weekly totals. Readiness uses both values at the end of the previous athlete-local day, so today's activity does not change the morning score.
```text
acute = ATL at the end of the previous day
chronic = CTL at the end of the previous day
ratio = acute ÷ chronic
```
The model uses **TRIMP across sports**, including cycling, running and swimming when usable heart-rate data is available. Power-based PSS and PSS/TRIMP calibration are not part of this component. An activity without usable heart-rate data can leave its training load incomplete.
| Ratio | Component score |
| --- | --- |
| 0.75× | 100 |
| 0.90× | 95 |
| 1.00× | 90 |
| 1.10× | 82 |
| 1.25× | 68 |
| 1.40× | 50 |
| 1.60× | 32 |
| 1.80× | 18 |
| 2.00× | 10 |
A complete rest day can contribute zero load. A missing dated row is a coverage problem, and CTL must be positive to supply a denominator. Incomplete heart-rate load is flagged rather than treated as evidence of a perfectly recorded light week.
Dashboard's **Current Load** and Readiness use the **same TRIMP ATL/CTL calculation**. Their displayed ratios can differ because Readiness stops at the previous day, while Current Load includes its selected date. Readiness also requires its 42-day history before showing the component. [ACWR](/features/acwr/) explains the Dashboard and Calendar ratio; [TSB](/features/tsb/) explains Form. Neither of those load-only metrics adds HRV or sleep to its calculation.
How the four components become one Readiness score
Each available factor is scored separately, then combined with a **weighted geometric mean**. The configured weights are:
| Component | Weight | Demo component score |
| --- | --- | --- |
| HRV | 35% | 67 |
| Resting HR | 15% | 44 |
| Sleep | 30% | 75 |
| Workload | 20% | 100 |
```text
L = sum(weight × ln(score))
W = sum(available weights)
Readiness = round_half_up(exp(L/W))
Demo:
L = 0.35 × ln(67)
+ 0.15 × ln(44)
+ 0.30 × ln(75)
+ 0.20 × ln(100)
W = 1
Readiness = 70
```
A geometric mean gives a low component more influence than an arithmetic average with the same weights. In this example, a light training week does not erase the lower physiological components. If all four components were 90, the combined score would also be 90.
The labels are **High at 85–100, Good at 70–84, Reduced at 50–69, Low at 30–49 and Very low below 30**. These are labels for the model output, not predicted percentages of performance capacity.
What happens when signals or history are missing
A displayed score requires at least **65% of the configured weight** and an available **HRV or resting-HR component**. Available means the factor can be scored, not just that a raw number exists. The remaining weights are rescaled across the components that can contribute; missing factors are not filled with a neutral score.
| Available scored components | Configured coverage | Can produce Readiness? |
| --- | --- | --- |
| HRV + Sleep | 65% | Yes |
| Resting HR + Sleep + Workload | 65% | Yes |
| HRV + Resting HR + Workload | 70% | Yes |
| HRV + Resting HR | 50% | No |
| Sleep + Workload | 50% | No; it also lacks a physiological component |
The **Weight** shown in the metric column remains the configured weight. If HRV and Sleep are the only available components, their effective shares become 35/65 and 30/65 for that result. This avoids giving the missing half of the measurement history an invented value.
[](/marketing/product/catalog-health-baseline-desktop.png)
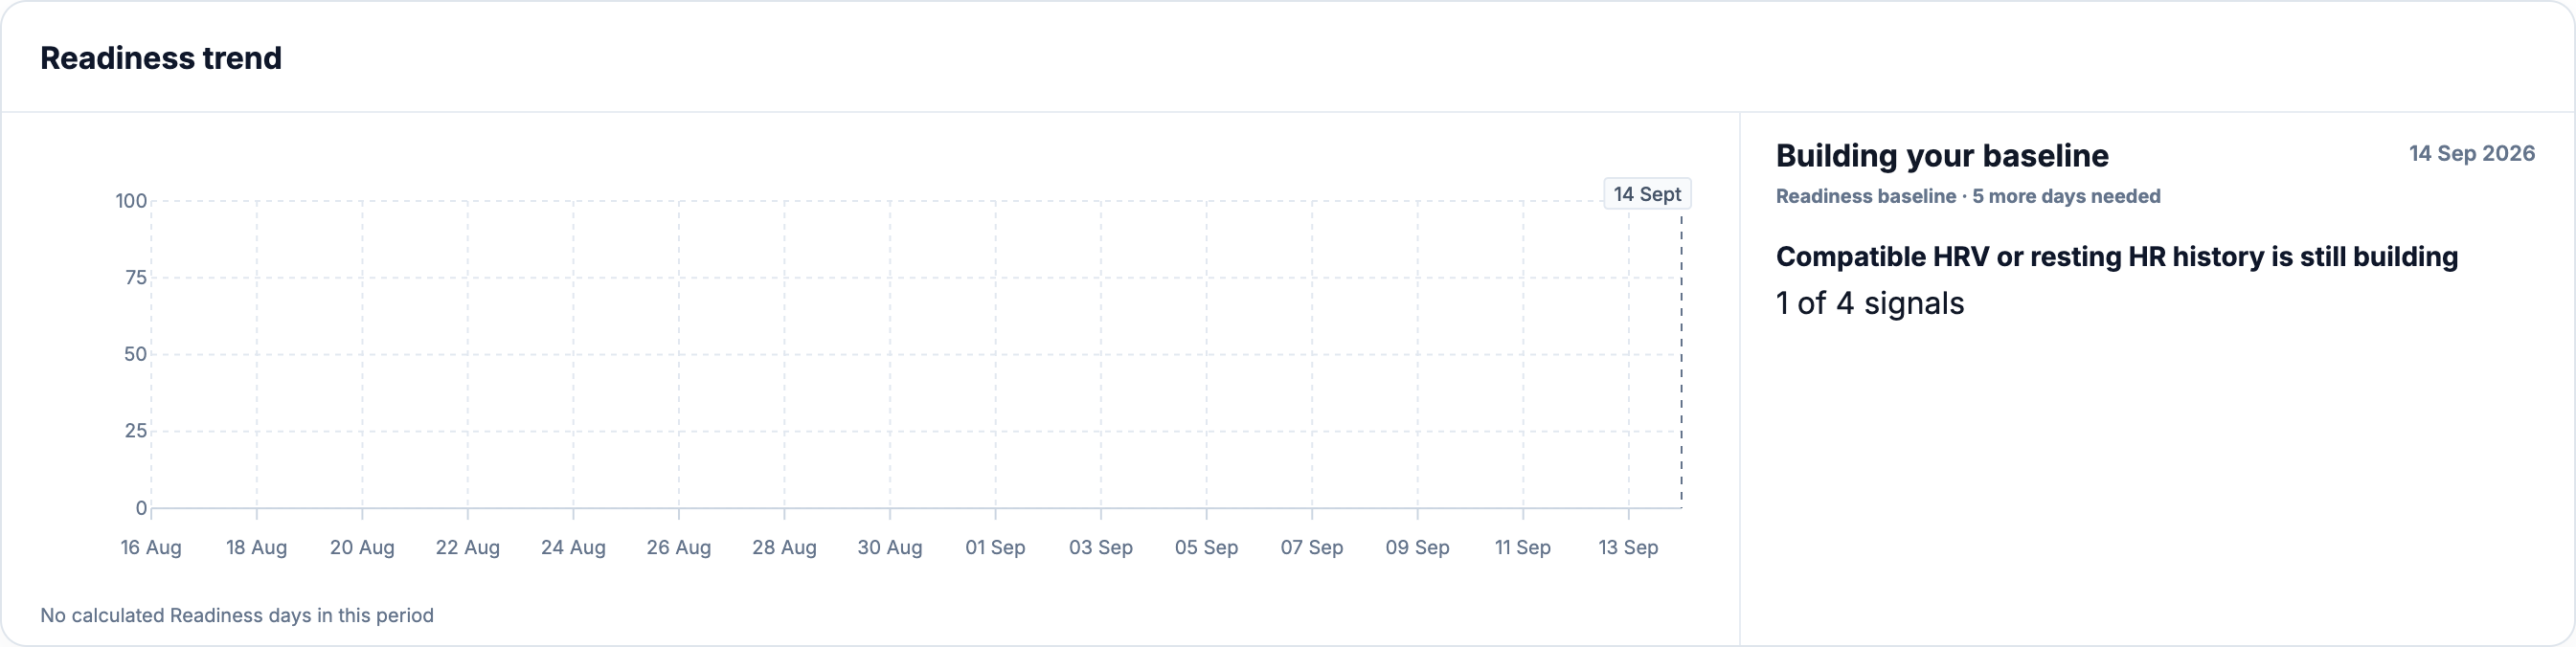
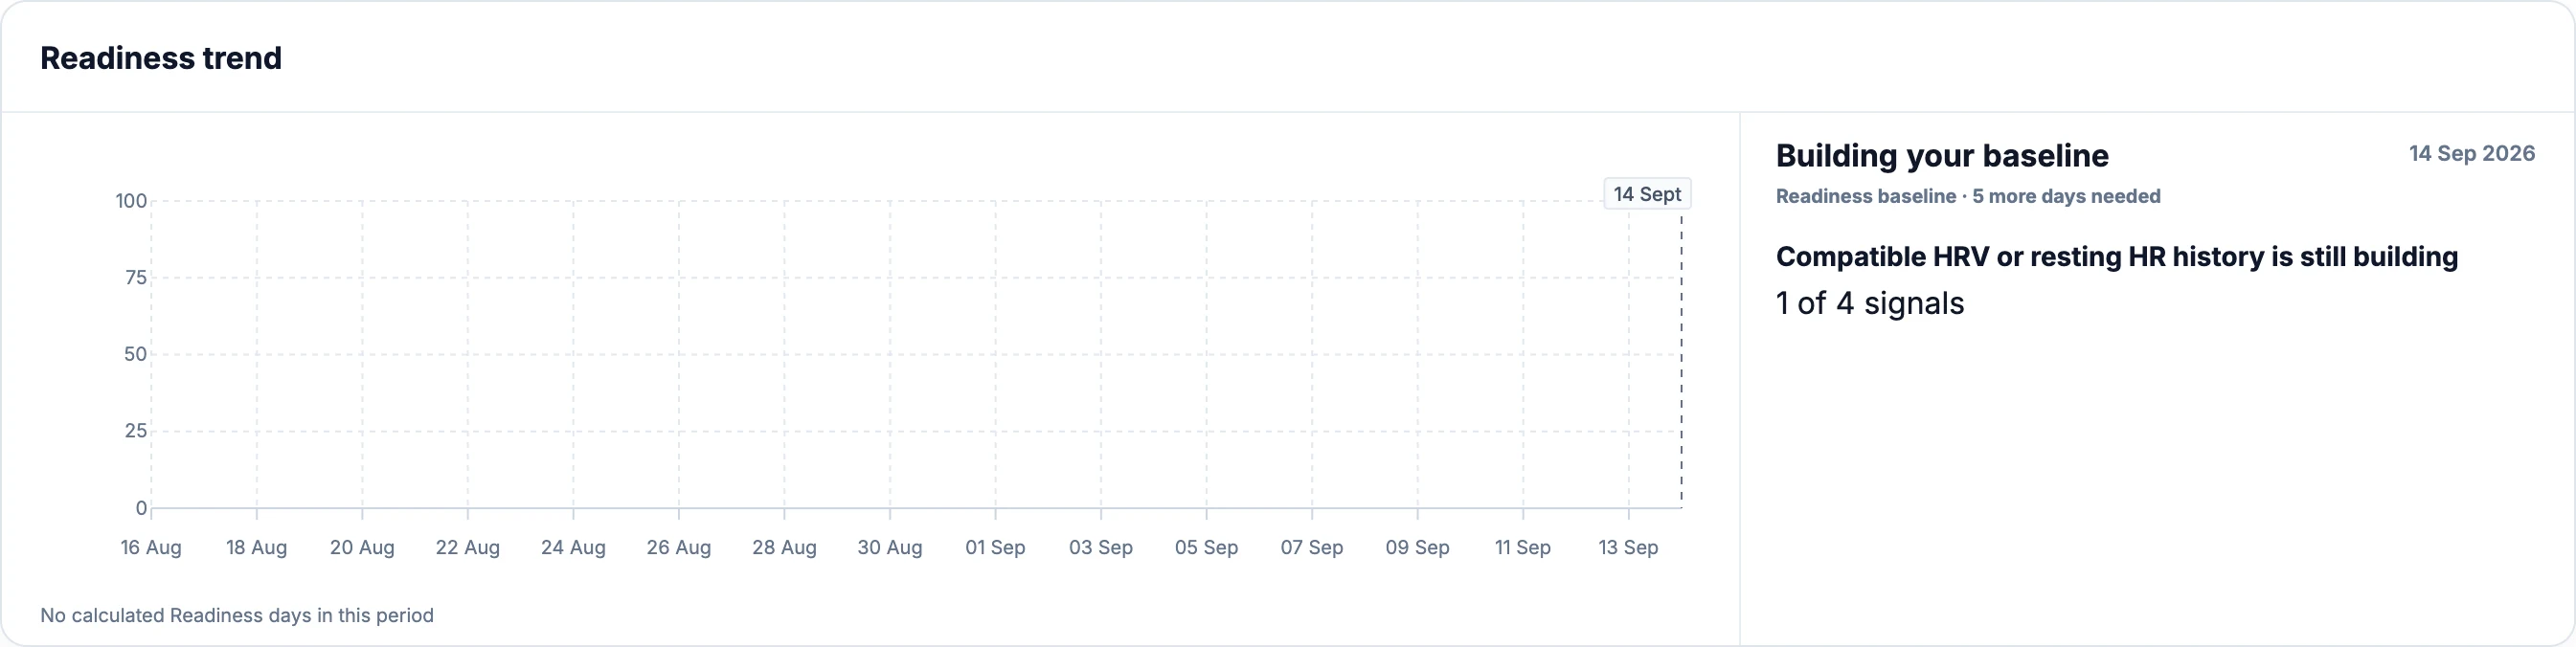
This second demo has today's measurements and nine prior compatible days. Today's reading is excluded from its baseline, so five more compatible days are needed to reach 14.Enlarge the baseline-forming state
**Building baseline**, **Insufficient data** and an unavailable component explain different gaps. A forming-baseline metric can show a measurement and a progress count while withholding its component score. Workload can be unavailable because its 42-day history is incomplete or CTL is not positive. Neither state means the athlete has low Readiness.
An eligible score can remain provisional while physiological history is still forming. **High confidence** requires all four components, reliable or mature physiological baselines and no quality flags. Eligible results with limitations use lower confidence. Flags can include an incomplete recent trend, using a recent trend without today's measurement, a default sleep target, a recent source change or an unusually extreme physiological reading.
Which health measurements actually affect Readiness?
The calculation uses **daily HRV, resting HR, sleep duration and workload**. Other stored health fields do not become hidden fifth or sixth factors. Sleep score, deep-sleep duration, SpO₂, steps, body weight, VO₂ max and stress BSI are outside the current Readiness formula. A field being available elsewhere in EffortSignal does not mean that it contributes to this score.
Daily measurements can arrive through a supported [device connection](/features/device-sync/) or supported objective fields in a [check-in](/features/check-ins-notes/). Data availability depends on the provider, permissions and the fields actually delivered. Importing an activity file cannot manufacture that night's sleep or daily resting HR.
The check-in's subjective entries, such as how you feel, are also separate from the sensor-based components. They can provide context when reviewing a day, but the current formula does not convert a feeling into HRV or silently add it as another weight. Check the source and method in the factor details when a manual measurement and an imported value appear to disagree.
HRV recorded **during a workout** belongs to the activity analysis below. It is not substituted for nightly HRV in Readiness. The completed workout can still contribute through the workload component.
HRV during a workout: open Heart rate, then R-R intervals
[Explore Workout HRV Analysis](/features/workout-hrv/)
Open a completed activity and select **Heart rate** above the charts. With a recorded R-R stream, the tab includes **R-R intervals** and **Beat-to-beat variability**. The first is a timeline in milliseconds; the second is a scatter plot with four summary metrics beside it on desktop and above it on a narrow screen.
Use **Settings** below the charts to choose visible rows and their order. The screenshots keep the R-R analysis visible. **Pan** moves through the time range and **Zoom** selects a shorter region by dragging across a time chart. [Activity Analysis](/features/activity-analysis/) explains the shared chart workspace and its navigator.
An R-R interval is the elapsed time between consecutive heartbeats. A sequence around **500 ms** corresponds to a beat period of about **120 bpm**; around **1,000 ms**, about **60 bpm**. Shorter intervals mean a faster heart rate. The spacing between the values describes variability that an ordinary heart-rate trace can conceal.
[](/marketing/product/catalog-health-rr-desktop.png)
The synthetic 40-minute ride has an 8-minute easy start, a 20-minute working block and a 12-minute easy finish. The R-R timeline shows the beat intervals through all three phases.Enlarge the R-R timeline
The working block is centred around **410 ms**; the finish is around **555 ms**. Hover the timeline to inspect recorded values and use Zoom to look more closely at the transitions or an isolated outlier. These synthetic phases illustrate what the chart displays, not a physiological test or an expected response for every rider.
The source file must contain beat-to-beat intervals. Compatible FIT imports can include separate HRV messages; EffortSignal places their R-R values into the activity stream in milliseconds. A device recording ordinary bpm once per second does not supply enough information to reconstruct HRV. A heart-rate chart can therefore be available while the R-R views are absent.
The four activity HRV metrics
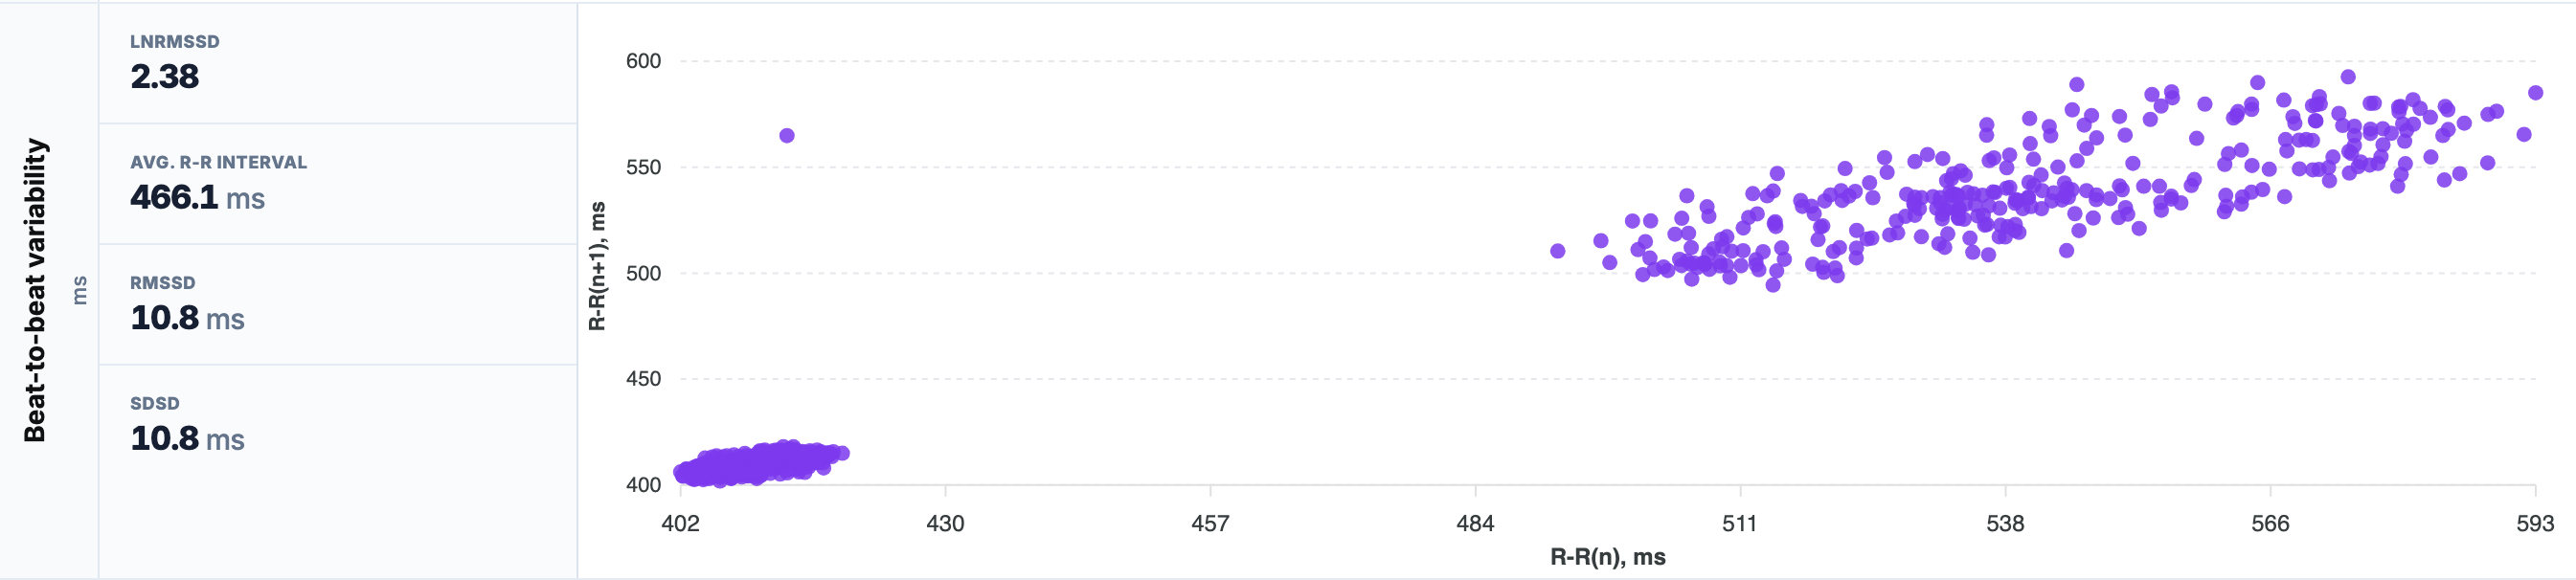
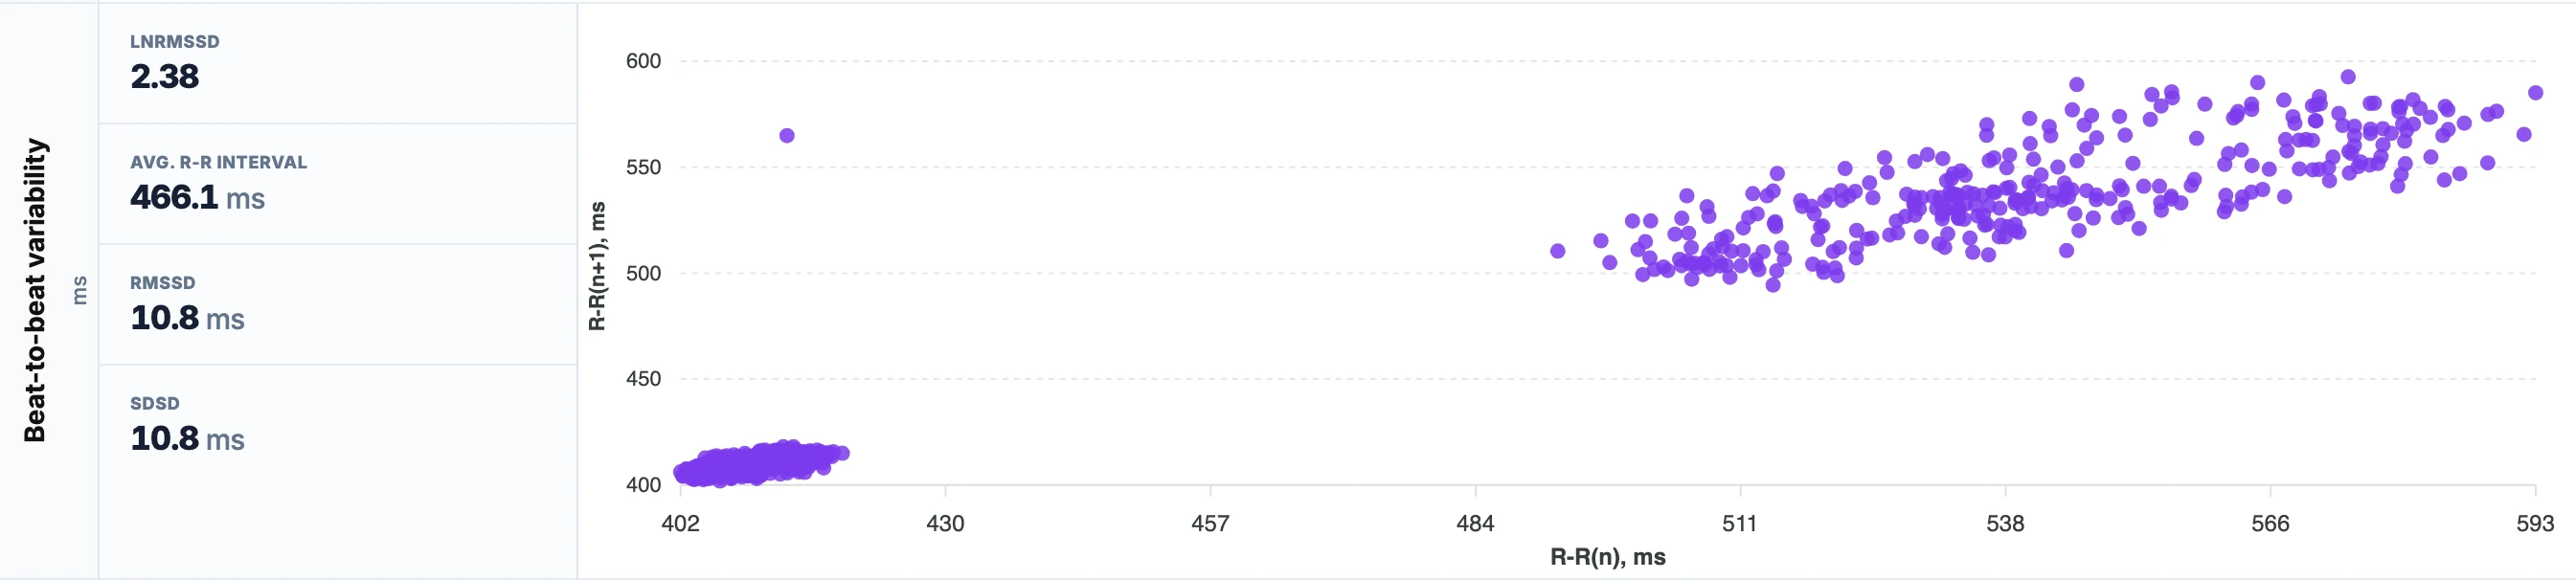
The summary shows **lnRMSSD, Avg. R-R interval, RMSSD and SDSD**. These are calculated from the available R-R intervals for the **whole activity**. Selecting a shorter time range zooms the timeline; it does not recalculate this four-value summary for that selection.
[](/marketing/product/catalog-health-poincare-desktop.png)
The side rail and the Poincaré plot describe the full recorded activity. The separate groups of points come from this demo's different riding phases.Enlarge the HRV metrics and scatter plot
| Metric | What EffortSignal calculates | Demo value |
| --- | --- | --- |
| Avg. R-R interval | Arithmetic mean of the available beat intervals | 466.1 ms |
| RMSSD | Square root of the mean squared difference between successive intervals | 10.8 ms |
| lnRMSSD | Natural logarithm of RMSSD calculated in milliseconds | 2.38 |
| SDSD | Sample standard deviation of successive interval differences | 10.8 ms |
RMSSD emphasizes beat-to-beat changes. SDSD measures the spread of those successive differences around their own mean, using a sample denominator. The two are close in this recording but are not defined as the same calculation. lnRMSSD expresses the RMSSD result on a logarithmic scale; it is not another millisecond reading.
For a small worked example, take four R-R values: **500, 510, 490 and 500 ms**. Their successive differences are **+10, −20 and +10 ms**.
```text
Average R-R = (500 + 510 + 490 + 500) / 4 = 500 ms
RMSSD = sqrt((10² + (−20)² + 10²) / 3) = 14.14 ms
lnRMSSD = ln(14.14…) = 2.65
SDSD = sqrt((10² + (−20)² + 10²) / (3 − 1)) = 17.32 ms
```
In this example the mean successive difference is zero; in the general SDSD calculation, that mean is subtracted before squaring. An average needs one interval, RMSSD needs at least two, and SDSD needs at least three. If RMSSD is zero, its logarithm is unavailable. Also, **60,000 divided by average R-R** is not necessarily identical to the arithmetic average of the activity's separately recorded bpm samples.
Read the Beat-to-beat variability plot
The chart is a **Poincaré plot**: each point pairs one interval, **R-R(n)** on the horizontal axis, with the next, **R-R(n+1)** on the vertical axis. Both axes are in milliseconds. Hover a point to see the paired values.
Points close to the diagonal have similar consecutive intervals. A wider spread away from that diagonal means larger differences from one beat to the next. Position along the diagonal also matters: points around 410 ms represent a faster heart rate than points around 555 ms.
The plot has no elapsed-time axis and does not follow the timeline's Pan or Zoom range. It combines pairs from throughout the recording. Use the R-R timeline to find **when** a change occurred; the scatter alone cannot tell you whether a group of points came from the start, a climb or a recovery section. EffortSignal does not overlay a fitted ellipse or report SD1/SD2 in this view.
Why inspect workout HRV alongside heart rate and power?
The practical starting point is the signal itself. You can inspect variation between beats beneath a relatively smooth bpm trace, locate transitions between riding phases and examine unusual isolated intervals before relying on a whole-ride summary. In this demo, the R-R timeline identifies the working block; the scatter shows that its pairs occupy a different part of the distribution from the easier finish.
Time-domain HRV usually falls as exercise intensity rises, partly in relation to changing cardiac parasympathetic activity. That is why low RMSSD during a hard interval cannot be interpreted as if it were a low nightly resting value. Intensity, exercise mode and recovery conditions affect the comparison. [Michael, Graham and Davis's review of exercise and post-exercise HRV](https://www.frontiersin.org/journals/physiology/articles/10.3389/fphys.2017.00301/full) describes these responses and the limits of interpreting them.
When reviewing repeated sessions, keep their structure and recording conditions in mind. An interval workout and a steady easy ride combine very different phases into their whole-activity RMSSD. Even equal-duration rides can have different proportions of work, coasting and pauses. A single aggregate cannot separate those effects or explain their cause.
EffortSignal currently provides the recorded R-R timeline, paired-interval plot and the four whole-activity metrics. It does not turn them into an in-workout readiness score, a lactate-threshold estimate, DFA α1 or an LF/HF “balance” score. For a question about output relative to heart rate, use [Efficiency Factor](/features/efficiency-factor/). For a change between the halves of a steady effort, use [Aerobic Decoupling](/features/aerobic-decoupling/).
What happens to gaps, outliers and long recordings?
The R-R path removes non-finite and non-positive values before building the charts and metrics. It does **not** perform a full ECG-based artefact or ectopic-beat correction. Positive outliers can remain. Dropped or extra detected beats can distort successive differences, and the formulas can amplify those errors. The [HRV measurement recommendations](https://www.frontiersin.org/journals/psychology/articles/10.3389/fpsyg.2017.00213/full) discuss why recording quality and artefact handling matter.
The displayed timeline and scatter are reduced to at most **800 points each** for rendering. The summary metrics use the underlying available R-R values before that display reduction, so averaging the visible points will not necessarily reproduce the side rail. Recorded intervals during pauses can also be included; this is not an active-pedalling-only HRV calculation.
Check the timeline, source recording and activity context if the summary looks unusual. EffortSignal's current R-R analysis is a way to inspect the available recording, not an ECG diagnosis. The night-based Readiness component remains a separate calculation with its own daily observations and personal baseline.
Implementation and further reading
These windows, weights, score mappings and display limits describe **EffortSignal 0.1.28**, checked September 16, 2026. The Readiness screenshots use the app's native TRIMP calculation. The physiology papers linked above provide context; they do not validate EffortSignal's exact Readiness formula. The shorter [Readiness calculation reference](/learn/readiness/) collects its core rules, while [Training Trends](/features/trends/) explains the wider Dashboard graphs.
All Pro features are free through January 31, 2027. No credit card or automatic charges. After Early Access, keep using Free or choose Pro. [See Free and Pro plans](/pricing/).