# Power & HR Curves
Canonical HTML: https://effortsignal.com/features/performance-curves/
Last content update: 2026-09-30
Open a recorded workout to compare its sustained power and heart rate with your history. Select several rides to put their curves together, or open Progress to compare the efforts recorded in two training periods. Each view pairs the graph with a table of values at the same durations.
Screenshots show synthetic training data in the web app. Activity curves, manual activity comparison and Progress are included in Free and Pro.
Open the power curve for one activity
For the modeled capacity used and restored during a ride, see [W′ Balance](/features/w-prime-balance/). Its timeline answers a different question from the best average power at each duration.
Open a recording from [Training Calendar](/features/training-calendar/) or the [Activity Library](/features/activity-library/), then select its **Power** tab. Scroll to **Power curve**. The graph is on the left and **Key durations** on the right; on a phone, the table sits below the graph and scrolls horizontally when needed.
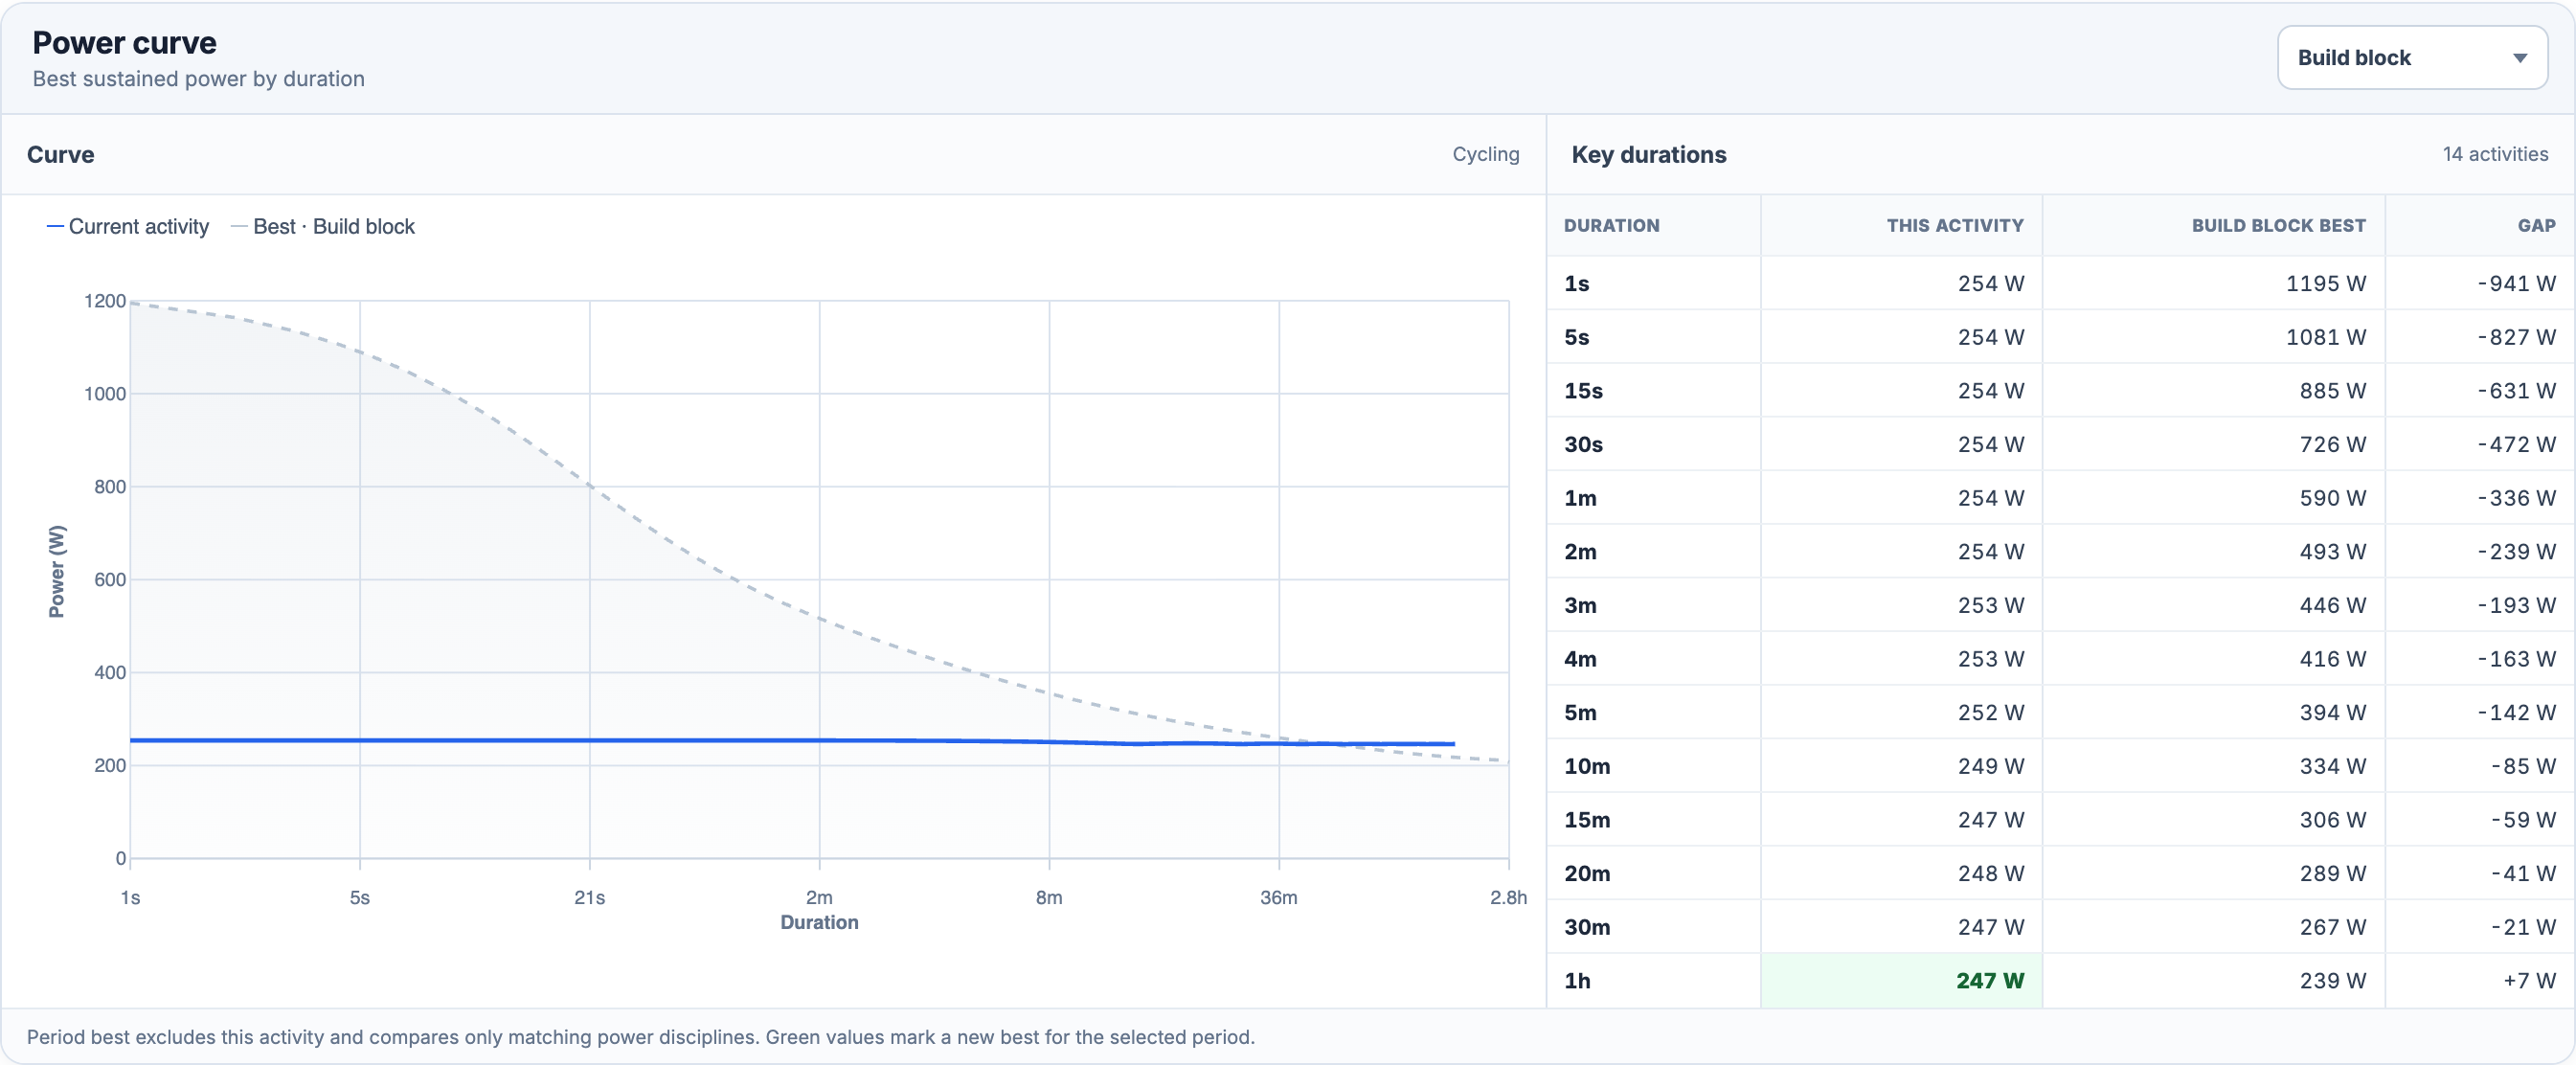
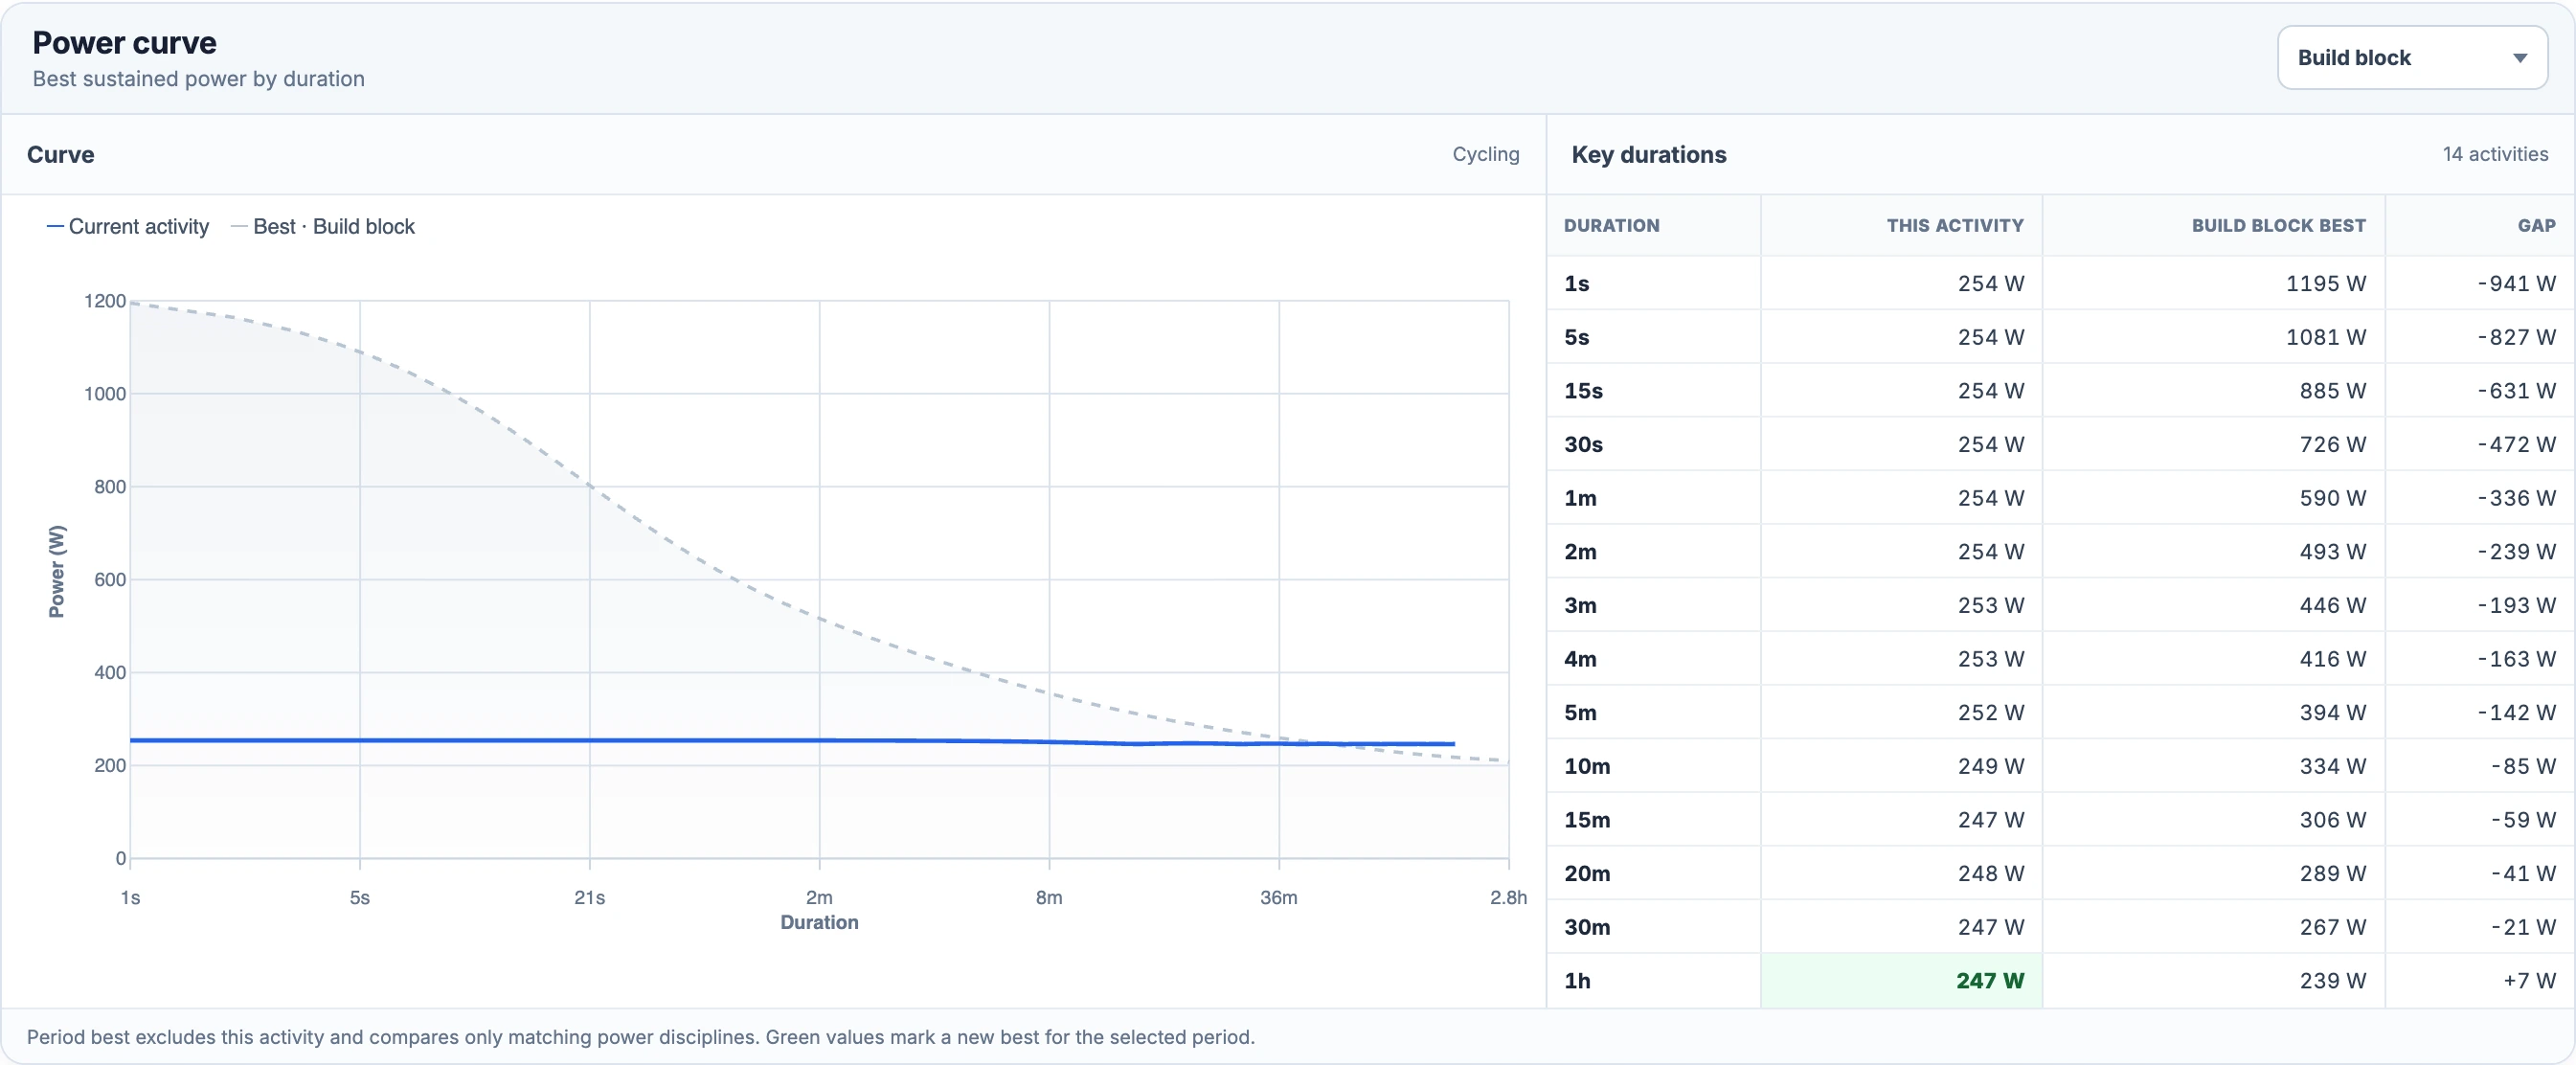
The blue line represents **Current activity**. The dashed reference and shaded area show the highest recorded averages in the selected comparison period. The table uses **This activity**, the period's best, and **Gap** columns. A green activity cell marks **New period best** when the recording exceeds an available historical value.
[](/marketing/product/catalog-curves-activity-power-desktop.png)
This Stelvio recording is compared with the saved Build block season. Its sustained one-hour power exceeds that period's reference, while its shorter efforts stay below it.Enlarge the activity power curve
Move the pointer along the graph to inspect a duration and its watts. The horizontal axis uses a logarithmic scale, giving short efforts enough room beside much longer ones. **5 min** means the highest average power found in any five-minute window of the recording. That window can occur anywhere in the ride.
The table provides fourteen checkpoints: 1, 5, 15 and 30 seconds; 1, 2, 3, 4, 5, 10, 15, 20, 30 and 60 minutes. The curve contains more calculated durations between those rows. Each point is calculated independently, so the best five-minute effort can come from a different part of the ride than the best twenty-minute effort.
Choose the history behind the reference
Use **Power comparison period** to choose **42 days**, **90 days**, **6 months**, **1 year**, a saved season, or **All time**. Rolling periods end at the activity's start time: opening an old ride compares it with the history available then. A saved season uses its own inclusive dates. Create those ranges in [Account and Training Preferences](/features/account-preferences/#seasons).
The reference excludes the open activity. For each duration, EffortSignal takes the highest available value from the other matching activities. A two-minute point and an hour-long point can therefore come from different recordings. The count above the table tells you how many historical activities contributed curve data.
Cycling power is compared with cycling, and running power with running. For other power-bearing sports, the comparison also keeps the matching discipline. **Gap** is this activity's value minus the reference value, calculated before the displayed watts are rounded. A dash means one side has no result for that duration; it is not a zero-watt effort.
Switch to the heart-rate curve
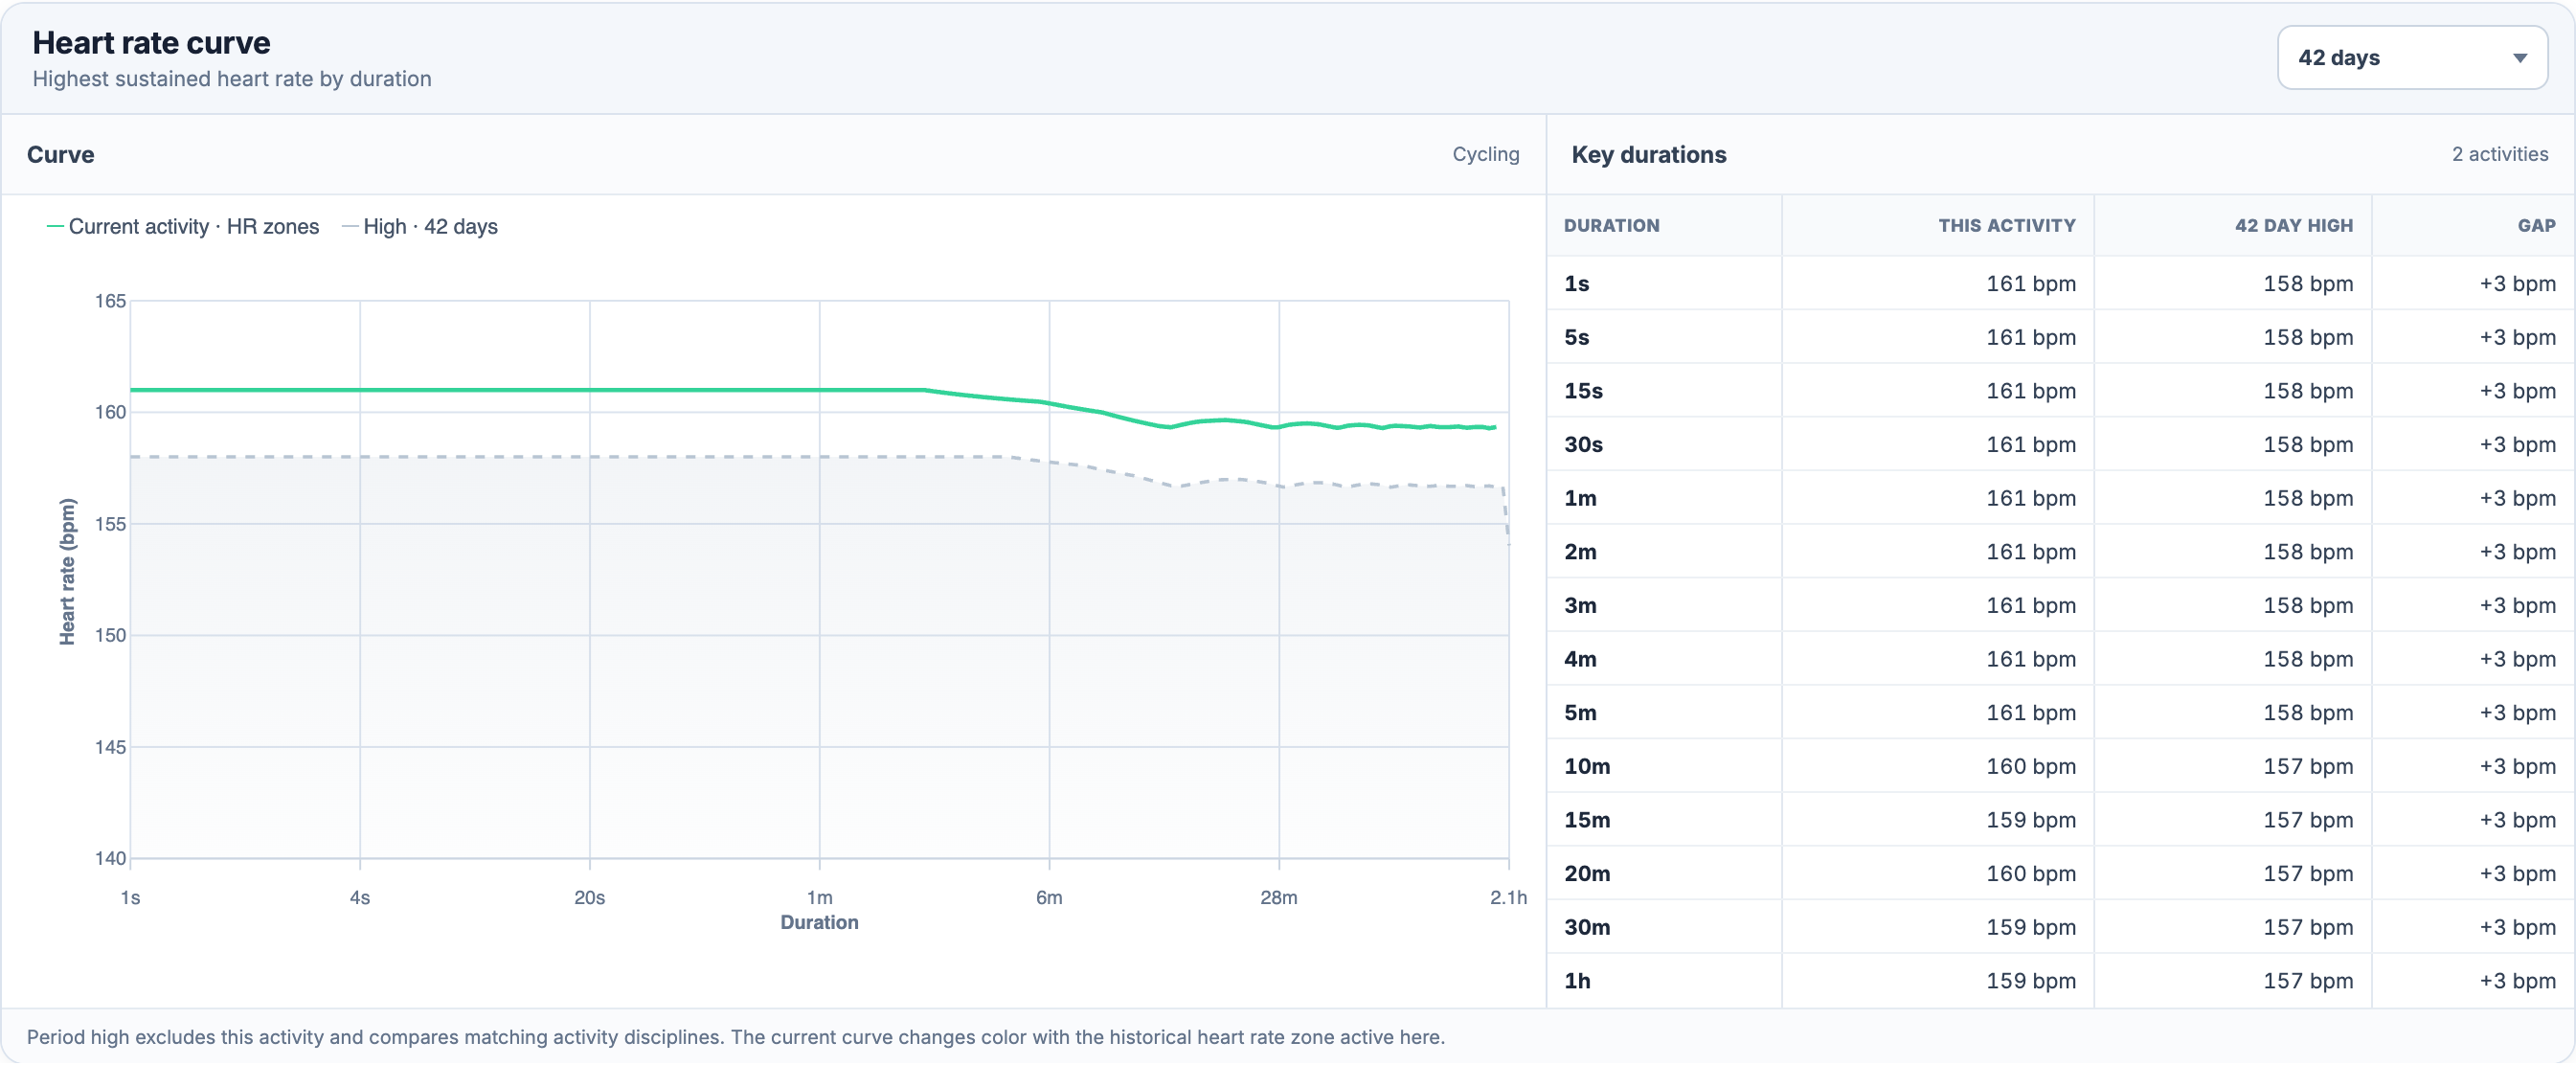
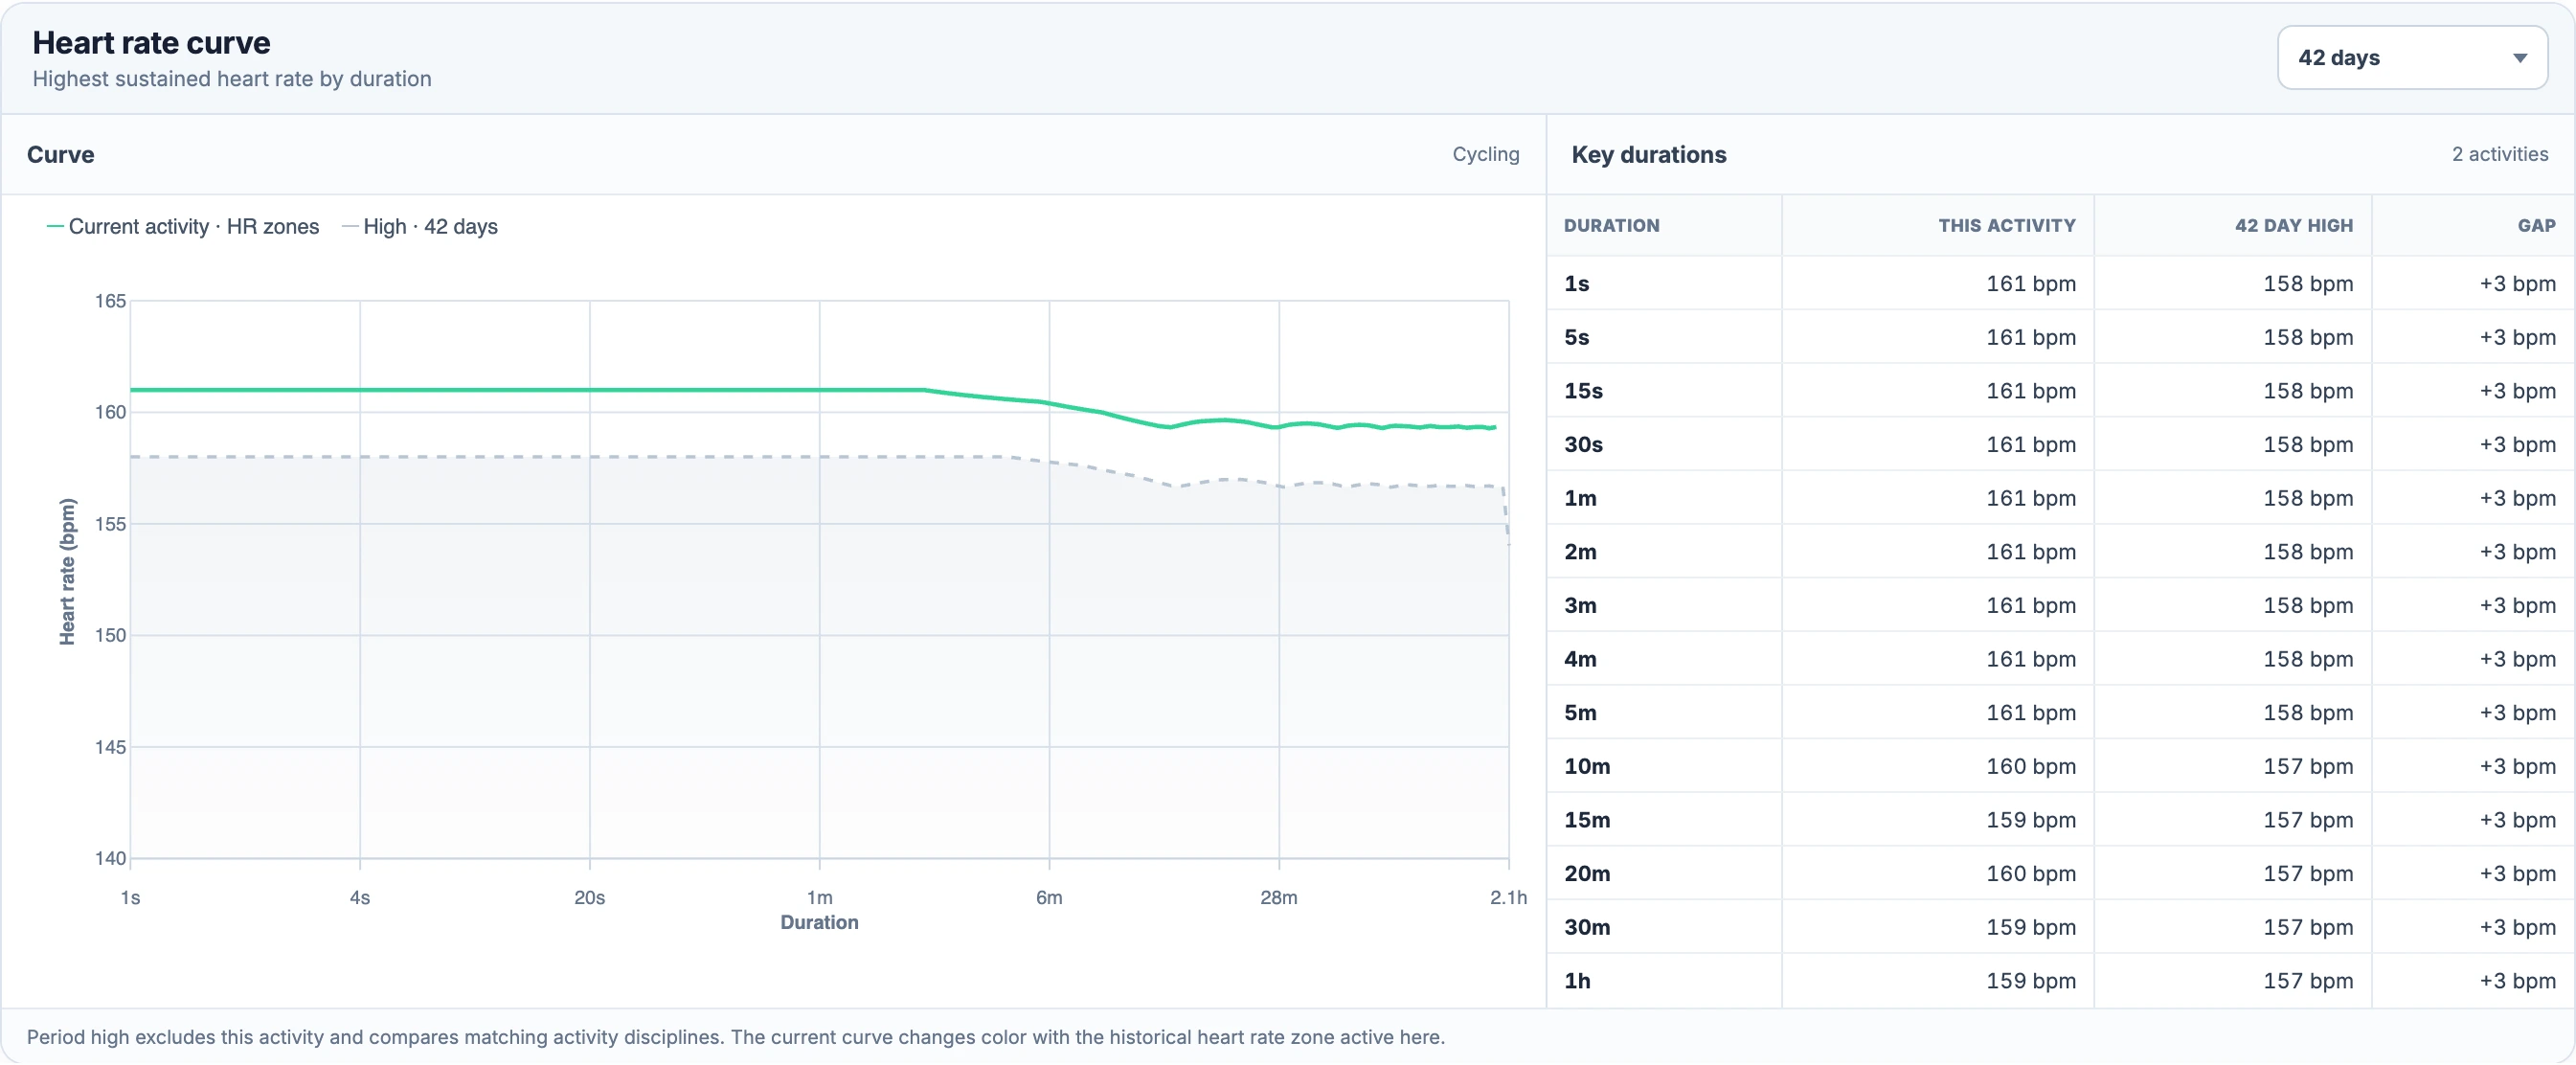
Select the activity's **Heart rate** tab and scroll to **Heart rate curve**. It uses the same graph-and-table layout, with bpm in place of watts and its own **Heart rate comparison period** selector. The reference column is labelled a period **high** rather than a power best.
Below the curve, [Aerobic Decoupling](/features/aerobic-decoupling/) compares power relative to HR between the activity's two halves. Its time-based EF graph answers a different question from a duration curve: when the output-to-HR relationship changed during the recording.
[](/marketing/product/catalog-curves-activity-hr-desktop.png)
The current curve changes colour with the heart-rate zones that apply to this activity. The table keeps heart-rate differences neutral.Enlarge the activity heart-rate curve
A five-minute HR point is the highest average pulse sustained across a usable five-minute window. It does not have to cover the same minutes as the five-minute power point. Use the [activity's timeline charts](/features/activity-analysis/#charts) when you need to see power and pulse at the same moment.
A higher HR curve alone does not establish improvement. It describes the pulse you recorded. Read it alongside the ride's output and conditions; power and heart rate answer different questions. HR cells do not receive the green record treatment used for power.
Put several rides on the same graph
Open **More actions** beside the activity title and choose **Compare**. Search for the other recordings, select them and press **Compare** in the dialog. You can compare up to five activities, including the starting recording. The full selection and metric controls are covered in [Activity Comparison](/features/activity-comparison/).
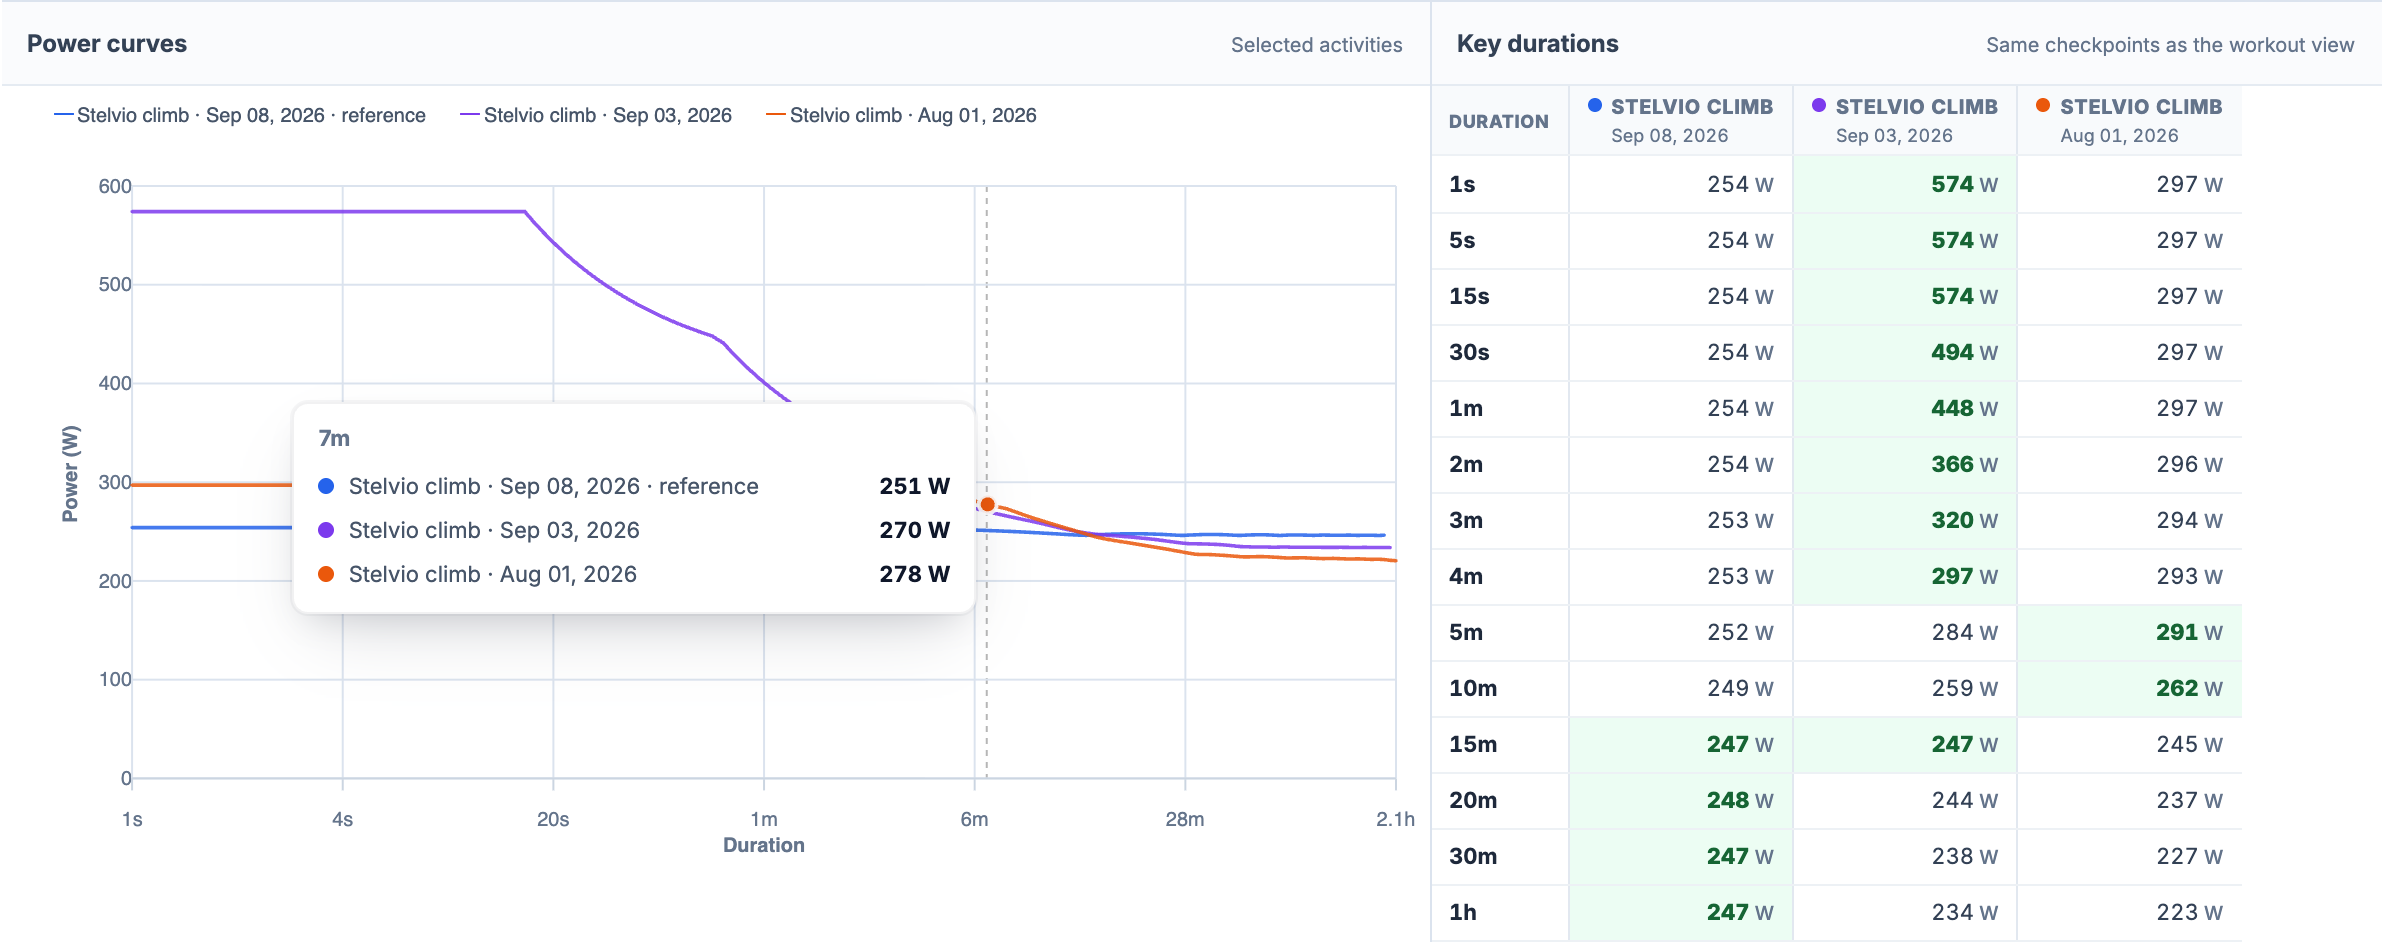
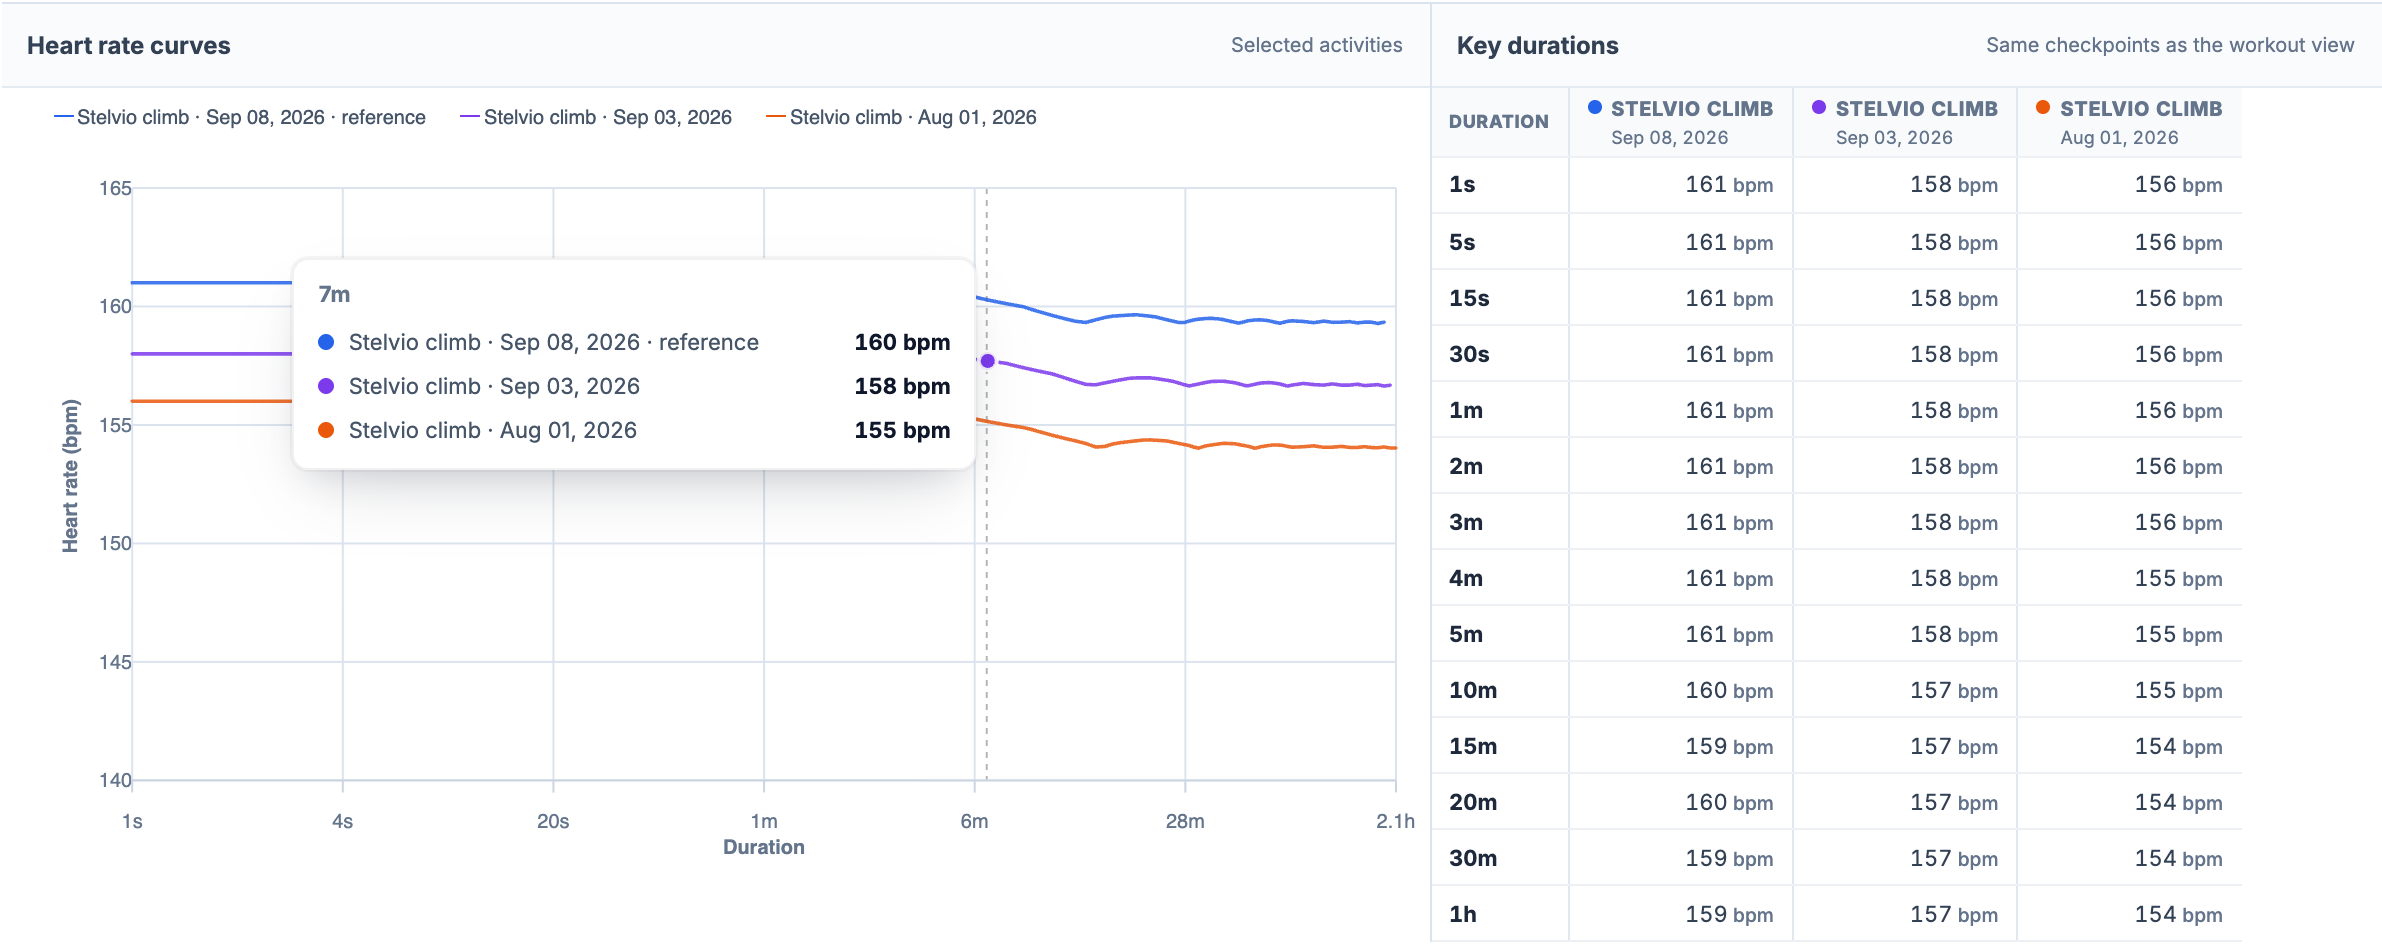
Scroll within the results to **Power curves** and **Heart rate curves**. Each recording has a consistent colour across the legend, graph and duration table. The dates below the table headings distinguish rides with the same name, such as repeated Stelvio climbs.
[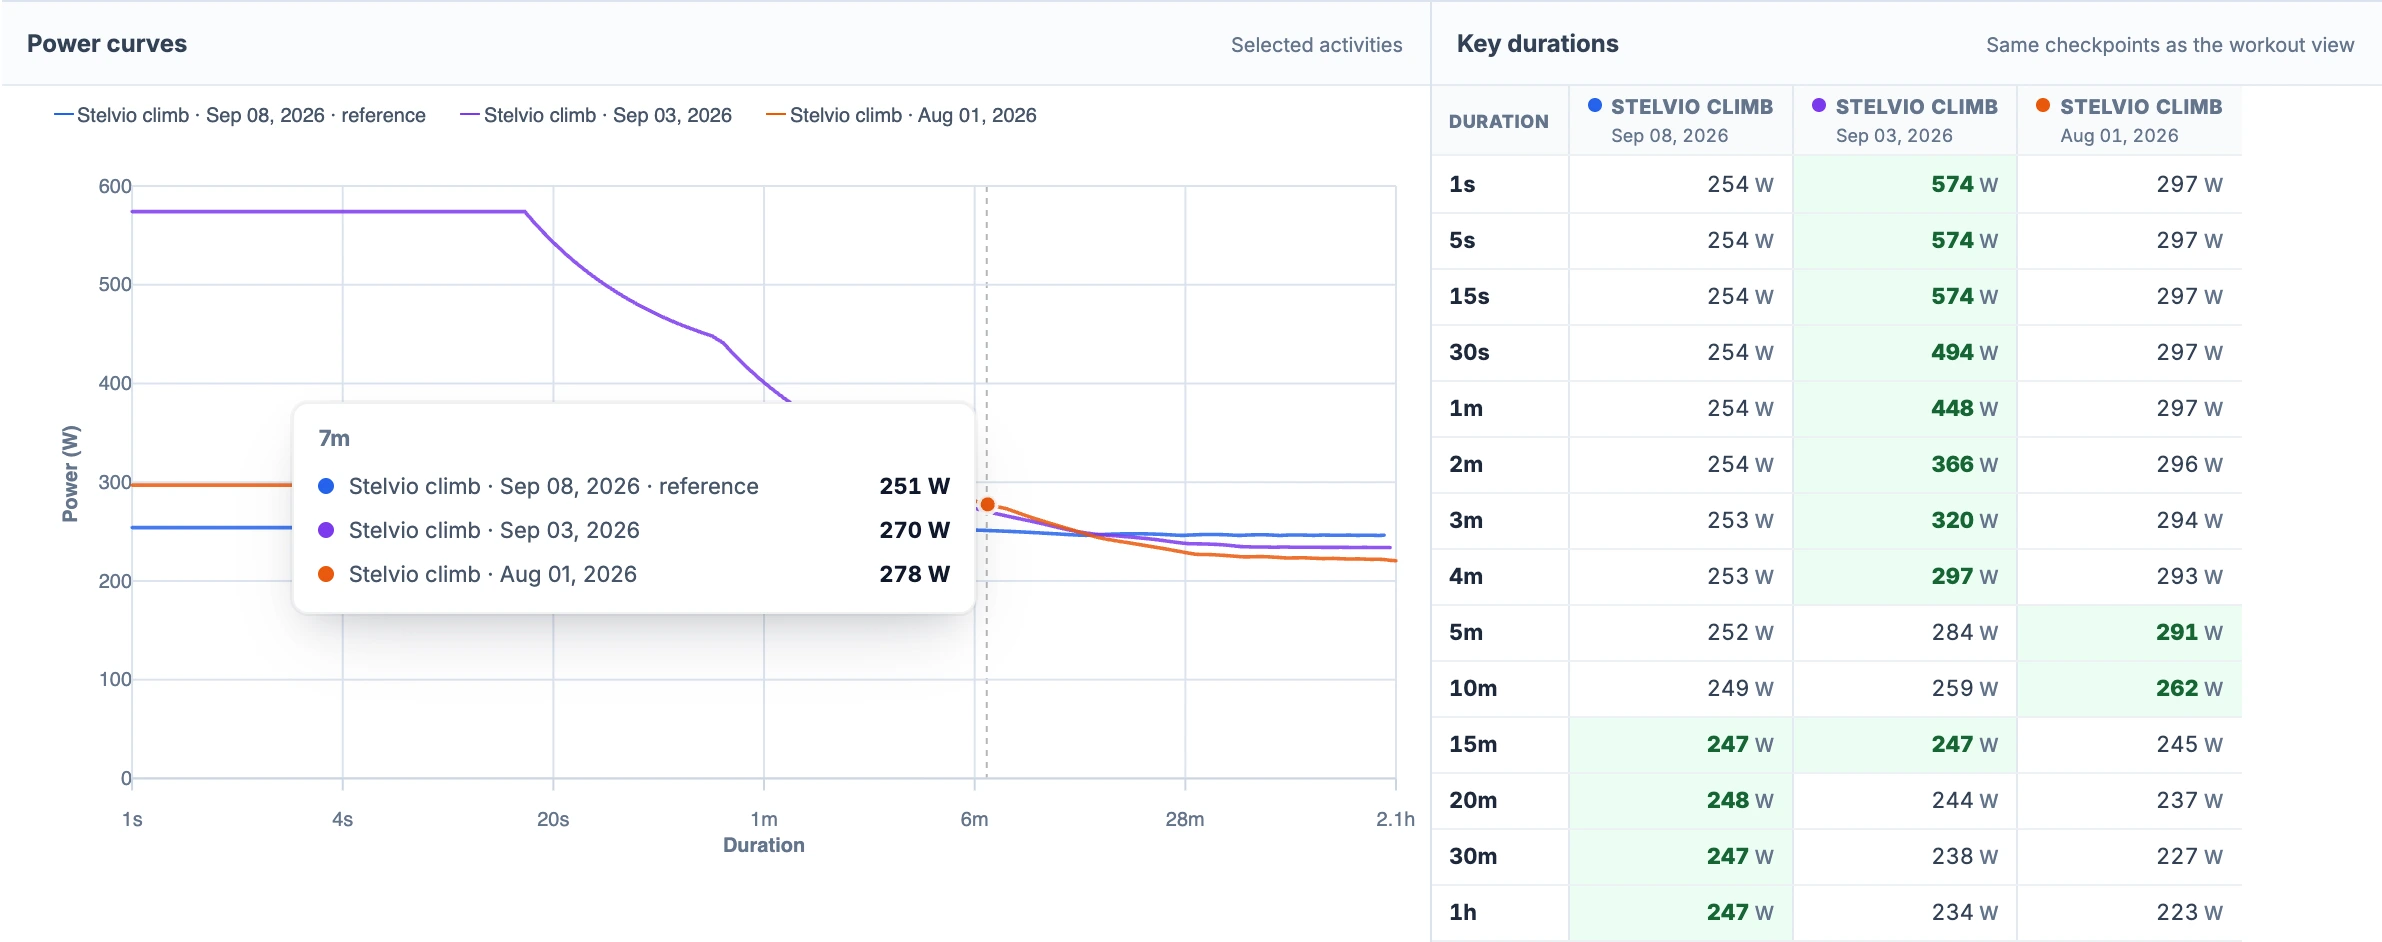](/marketing/product/catalog-curves-compare-power-desktop.png)
Hover over one duration to read all visible recordings together. The tooltip includes each ride's date; a missing value appears as a dash. On a narrow screen, scroll this screenshot sideways to see the full table.Enlarge the power comparison tooltip
The tooltip follows the exact duration being inspected. It lists every visible curve, even when a recording has no value at that duration. Use the legend to hide a series while inspecting the others. The table remains available for reading fixed checkpoints without holding the pointer in place.
At each table duration, the highest available power gets a green background when at least two rides have values to compare. Ties at the displayed watt precision are included. Different rides can lead at different durations: a sprint effort and a sustained climb need not favour the same recording.
[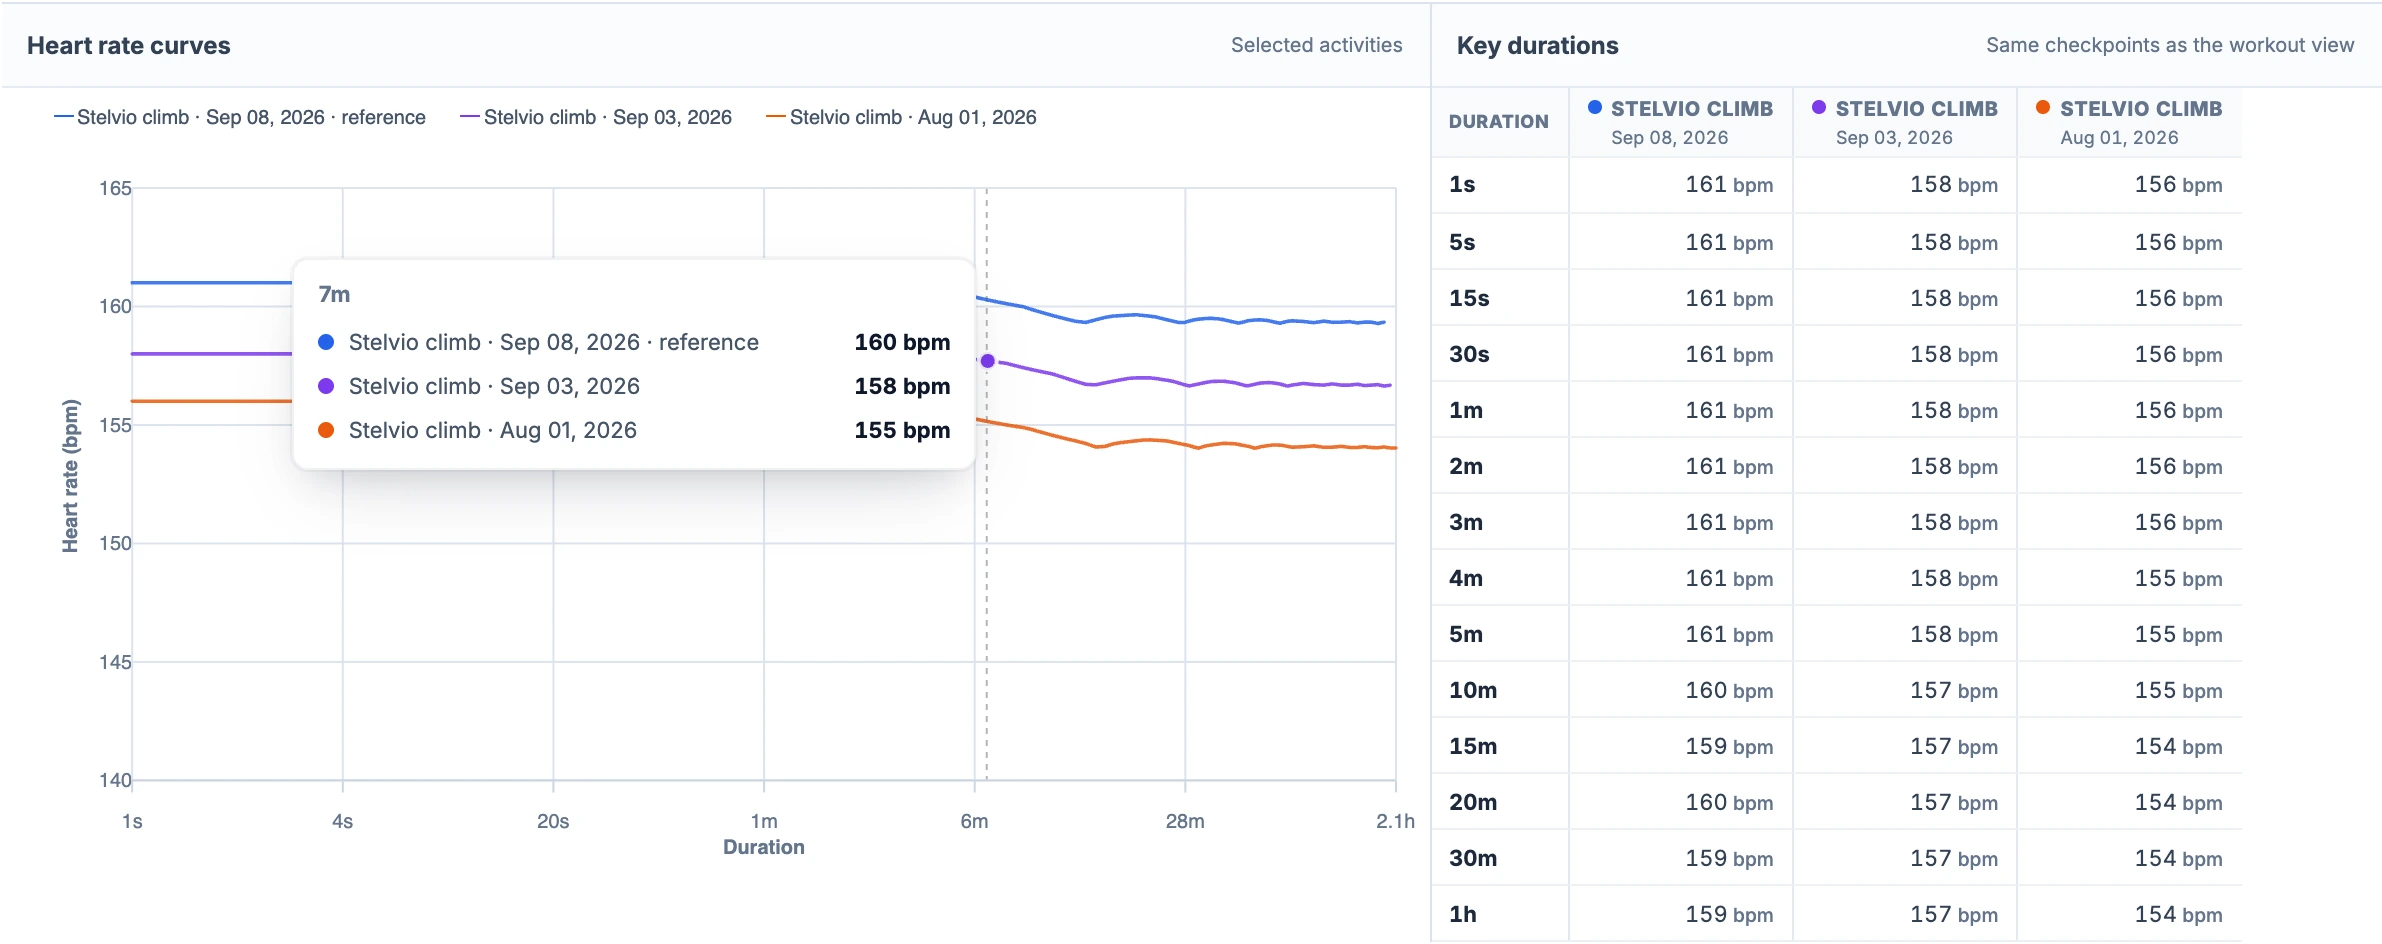](/marketing/product/catalog-curves-compare-hr-desktop.png)
The HR comparison keeps the same ride colours and dates. Its table reports bpm without declaring the highest pulse a winner. This screenshot also scrolls sideways on a narrow screen.Enlarge the heart-rate comparison tooltip
Compare two training periods in Progress
Open **Progress**, choose the two date ranges with **Quick compare** or **Custom range**, and select a sport. Scroll to **Performance**. Cycling opens on **Power**; the **Heart rate** tab switches the same surface to sustained pulse. With **All sports**, the report keeps each sport's performance in its own section.
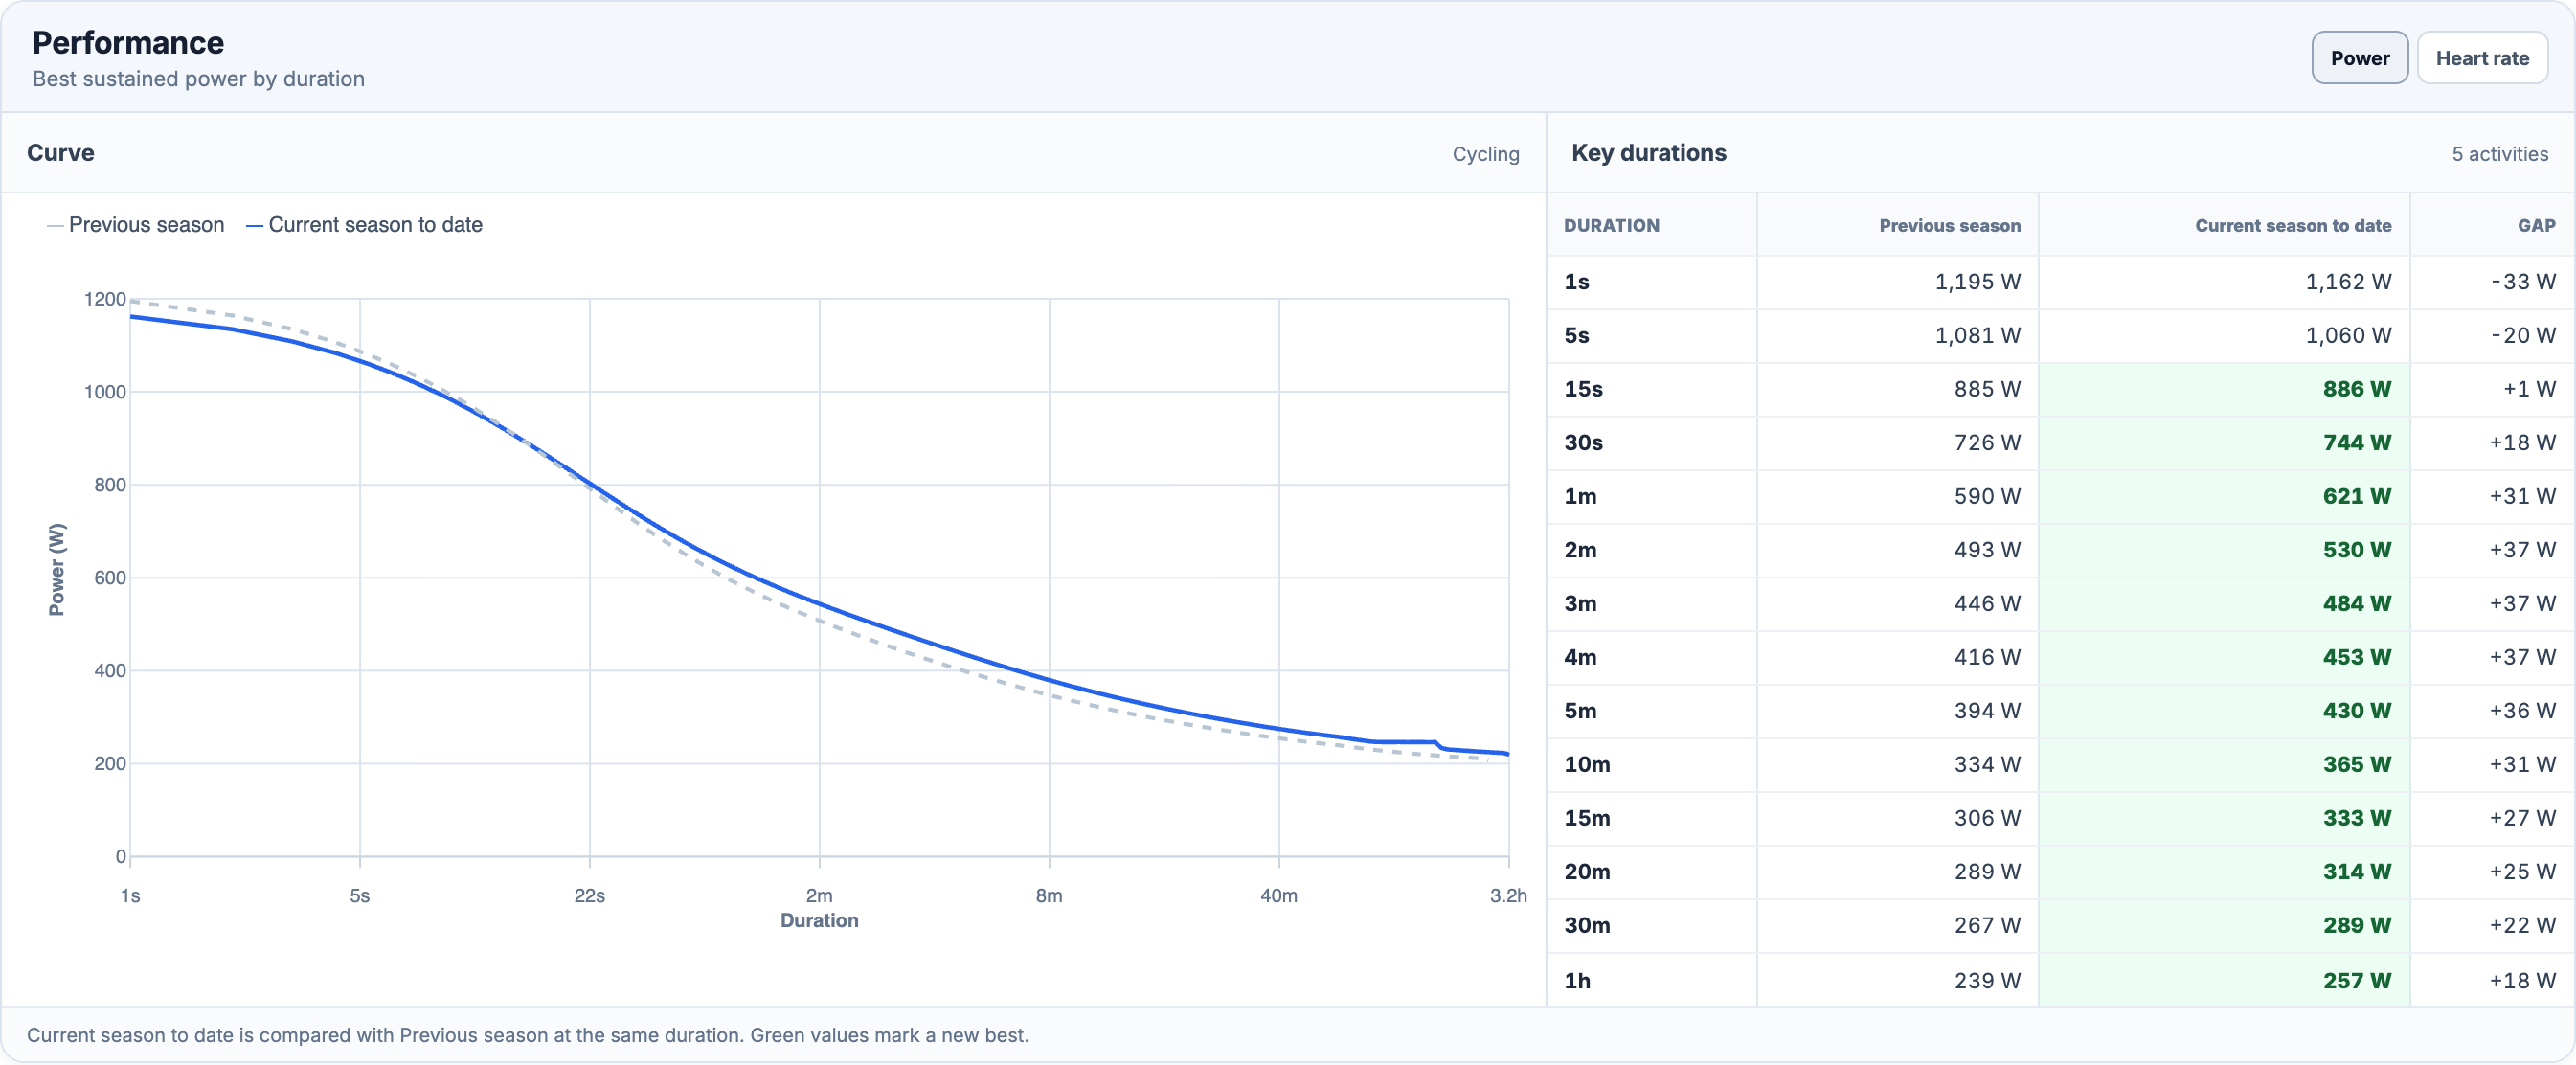
Both curves now collect the best recorded value at each duration from their respective periods. The baseline is dashed and the other period's power curve is solid blue. The legend and table use the selected period names, such as **Previous season** and **Current season to date**.
[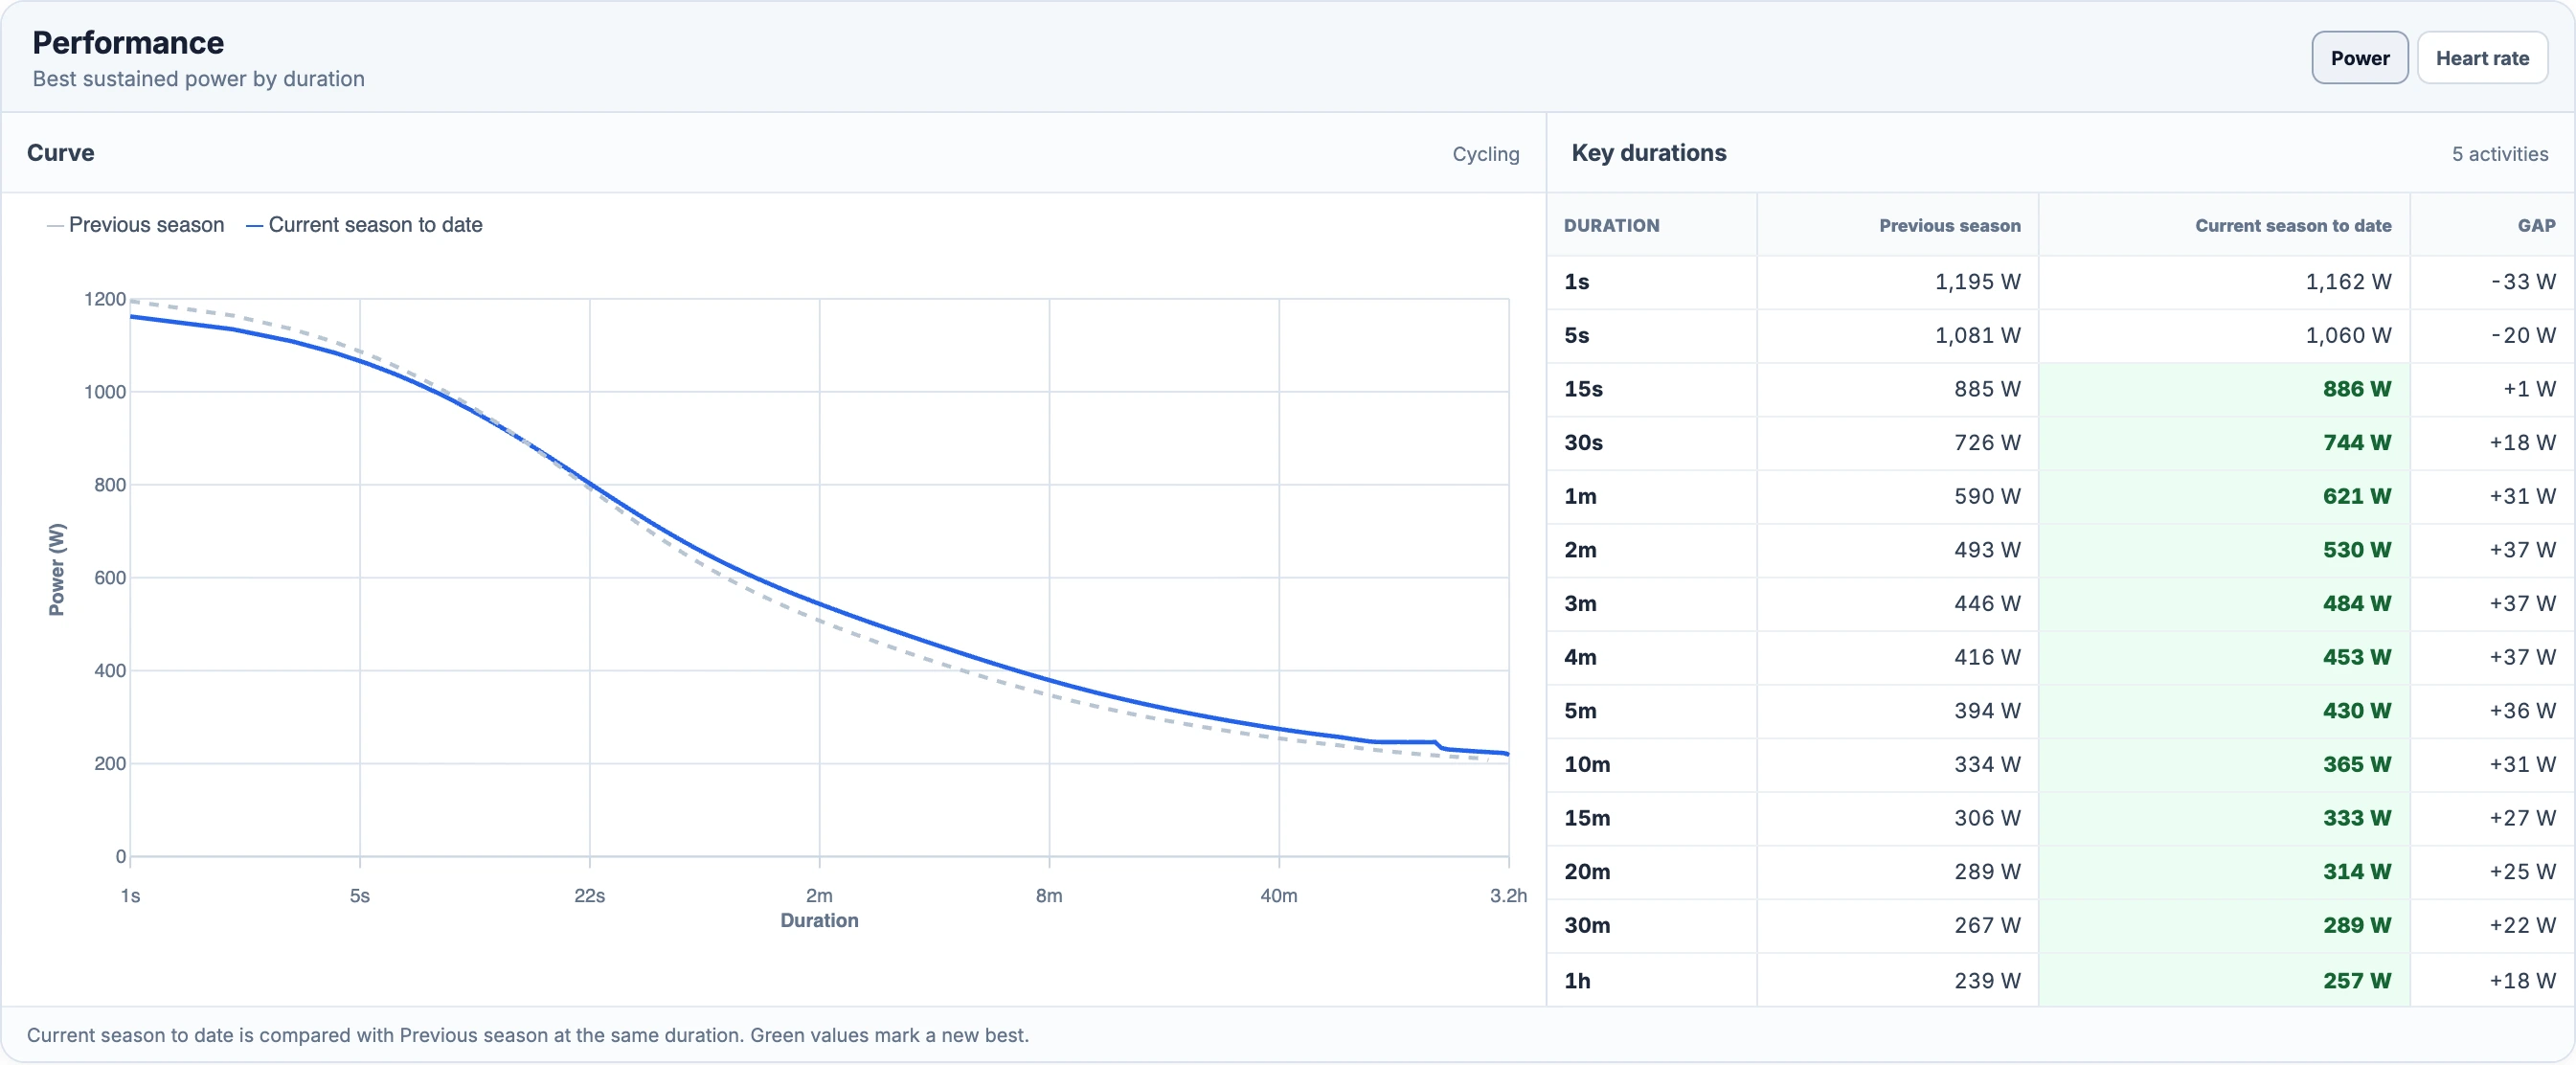](/marketing/product/catalog-curves-progress-power-desktop.png)
In this example the previous season leads through ten seconds. The current season moves ahead by fifteen seconds and stays higher at longer efforts. Each table row comes from the same period results as the graph.Enlarge the seasonal power comparison
Read **Gap** as the right-hand period minus the left-hand period. Here, five-minute power rises from **394 W to 430 W**, a gap of **+36 W**. The right-hand power cell turns green when it exceeds the baseline. These values compare recorded efforts; an easy block may contain no attempt at a maximum, even if you were capable of more.
For named seasons, rolling periods and the rest of the report, see [Progress](/features/progress/#periods). The comparison dates above the report determine which recordings contribute to every performance section.
Compare sustained pulse across periods
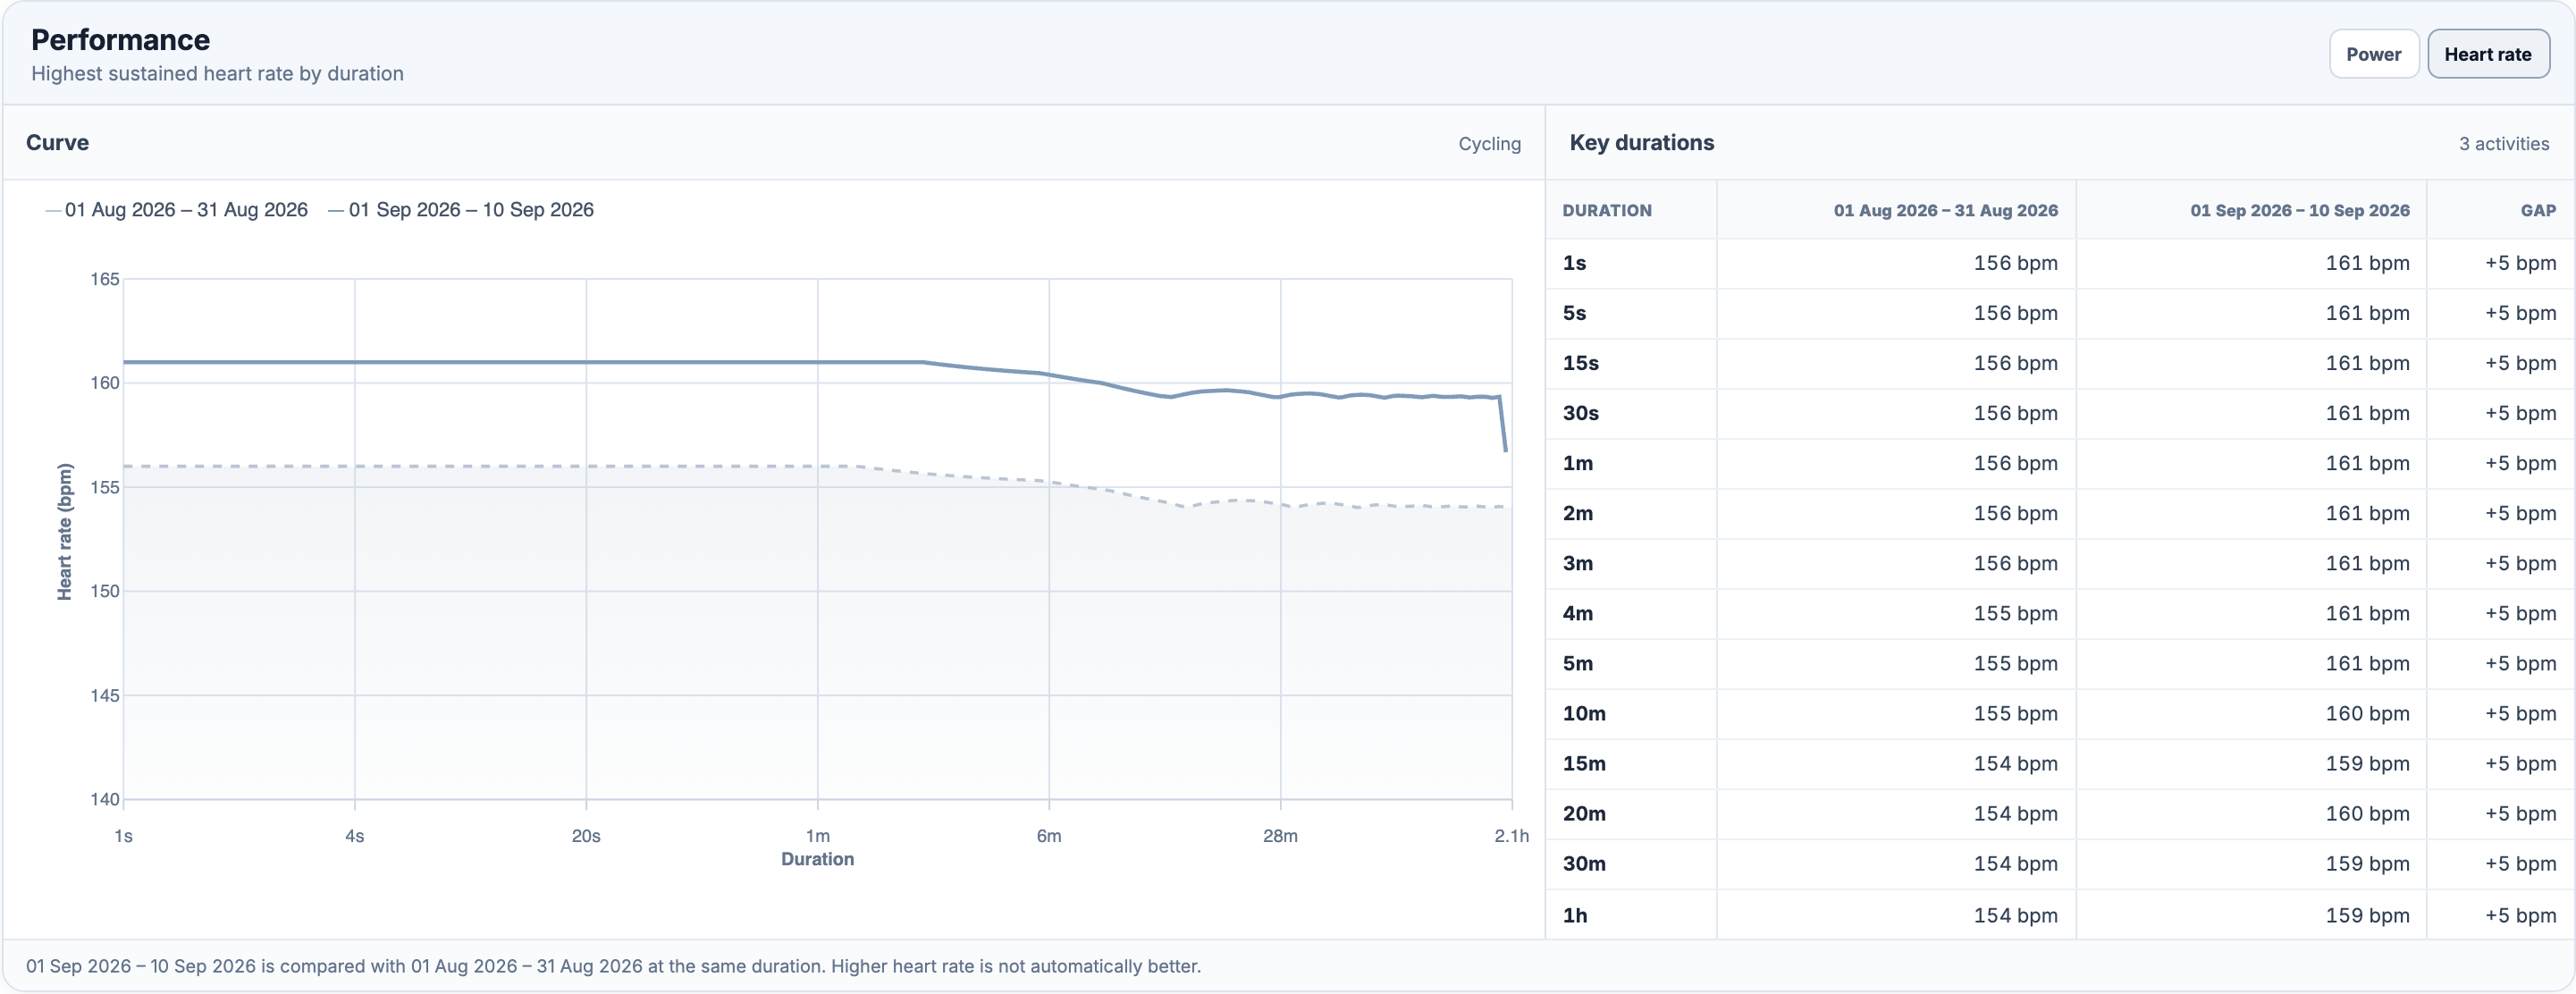
Choose **Heart rate** in Performance. The period names, duration rows and signed gaps stay in place while the units switch to bpm. Higher pulse retains neutral table styling.
[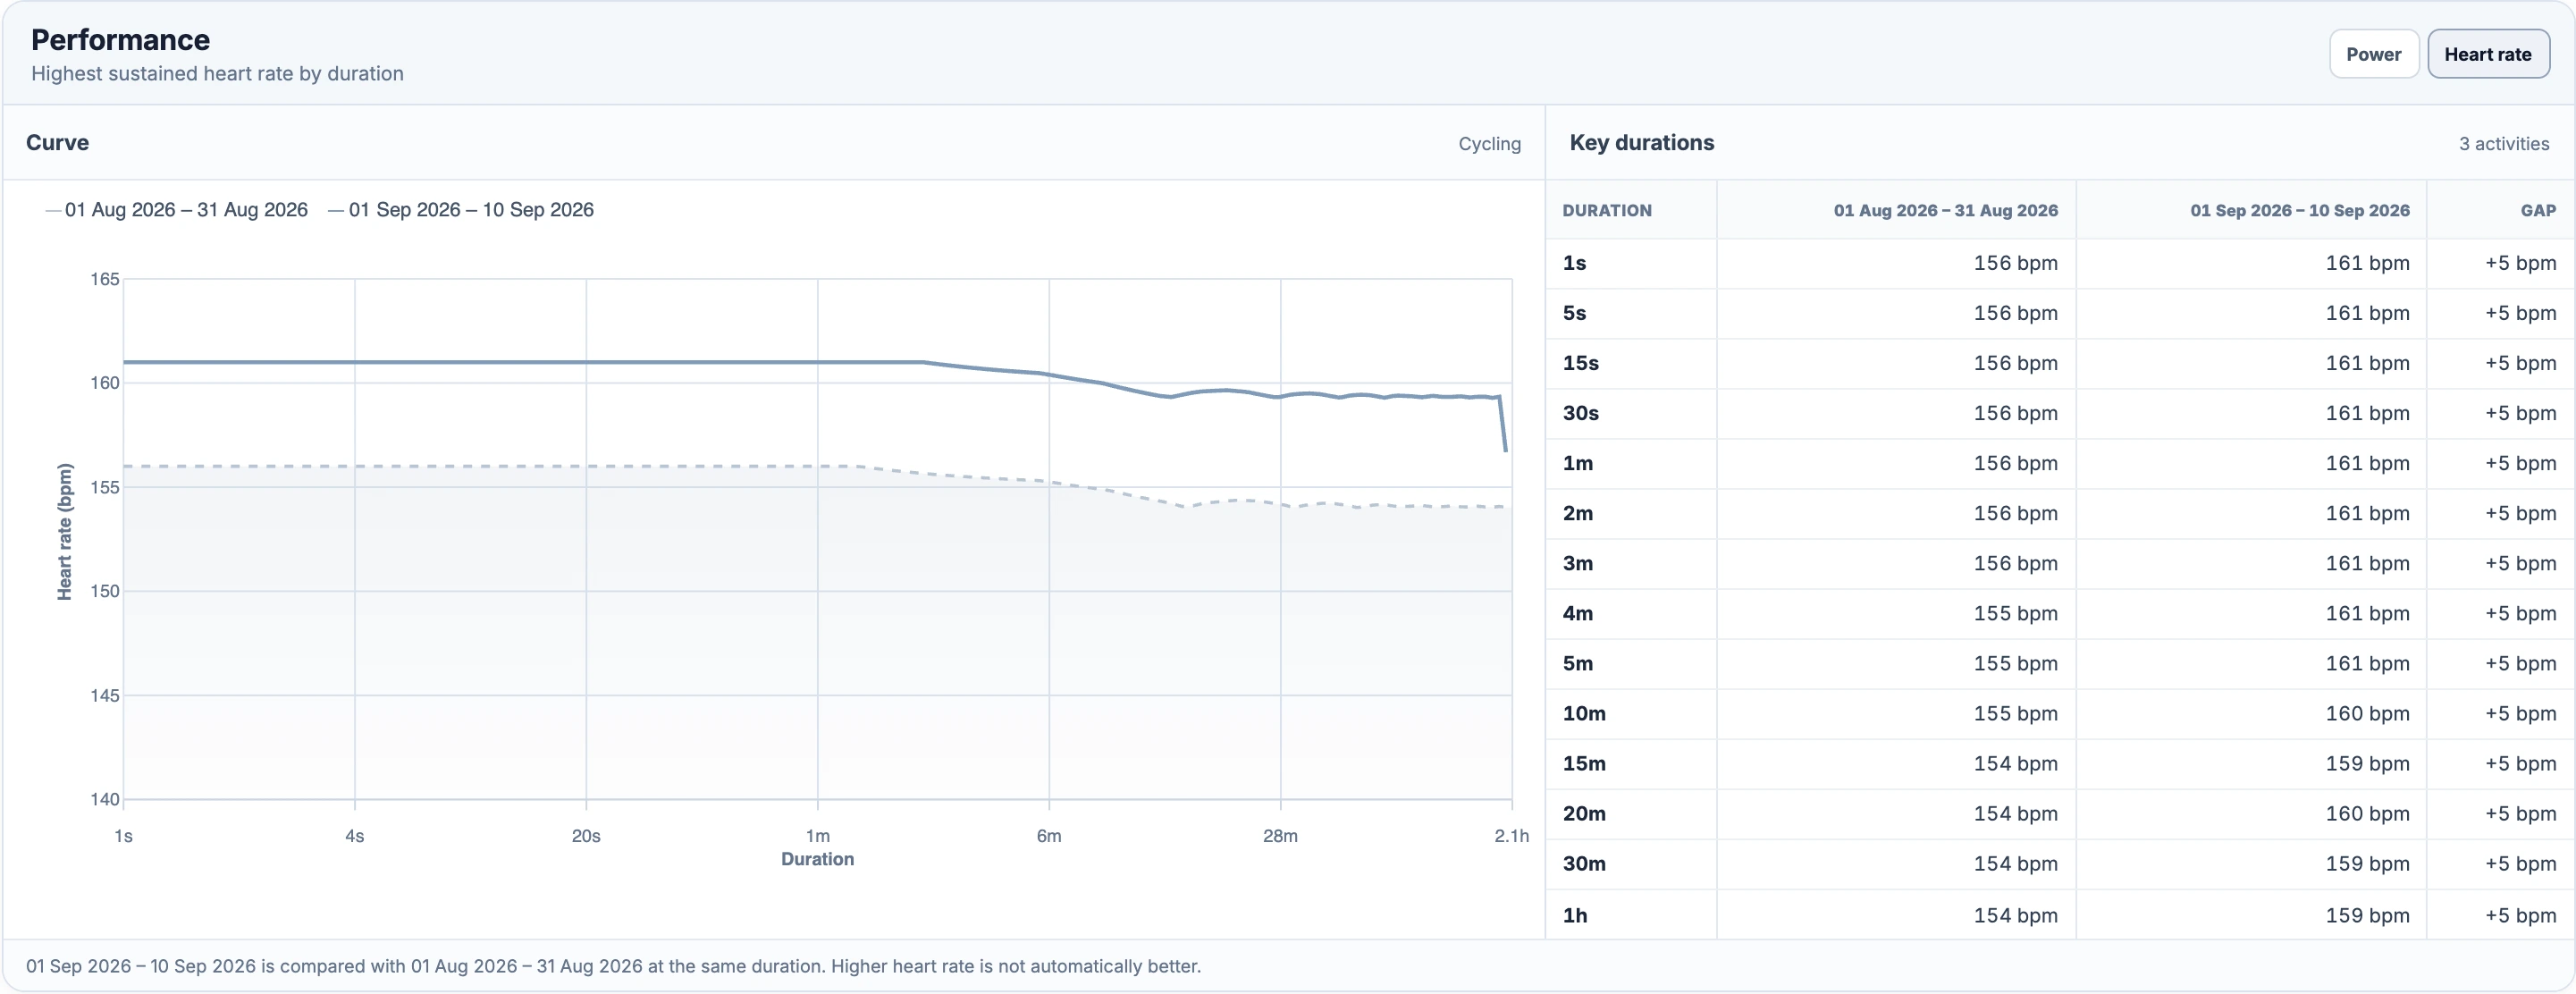](/marketing/product/catalog-curves-progress-hr-desktop.png)
This separate comparison selects August and 1–10 September. It includes the recorded heart-rate efforts from the Stelvio examples in those ranges.Enlarge the period heart-rate comparison
Power and HR use their own available recordings and samples. A period can have a power curve and little usable HR history, or the reverse. An unavailable curve is explained in the panel instead of being drawn as a flat zero line.
Find the recordings behind the period
At the bottom of Progress, **View activities** opens the Activity Library with that period's dates and sport filter. Open a recording there to examine its time-series charts, intervals and conditions. **Download CSV** exports the report, including source activity IDs for the stored duration results.
A period curve joins independent best efforts. To understand one session as a whole, return to its [Activity Analysis](/features/activity-analysis/). To follow the same stretch of road across rides, use [Private Segments](/features/private-segments/).
Running also has a Pace view
Select **Running** in Progress to open **Pace**, with **Power** and **Heart rate** alongside it when applicable. Pace compares the fastest recorded sustained efforts in time per kilometre or mile. Its differences say **faster** or **slower**, and the rows include dated **Source** links. Running power remains separate from cycling power.
What can leave a duration missing?
Curves need recorded samples and enough recording time for each window. A thirty-minute activity cannot supply a sixty-minute effort. A summary containing only average power or average HR cannot reconstruct the individual windows.
The two calculations handle gaps differently. Power uses an elapsed-time timeline: paused seconds and gaps beyond the sample-hold limit contribute zero power. HR requires a fully covered window after the same bounded sample hold; windows crossing a longer sensor gap or pause are excluded. Smart-recorded samples can be held until the next valid sample, for at most 30 seconds.
These rules can leave long HR durations absent while shorter ones are present. They also explain why a power curve and an HR curve may end at different durations for the same ride. The activity shows an updating message while its curve is being calculated. Failed comparison requests offer **Try again**.
All Pro features are free through January 31, 2027. No credit card or automatic charges. After Early Access, keep using Free or choose Pro. [See Free and Pro plans](/pricing/).